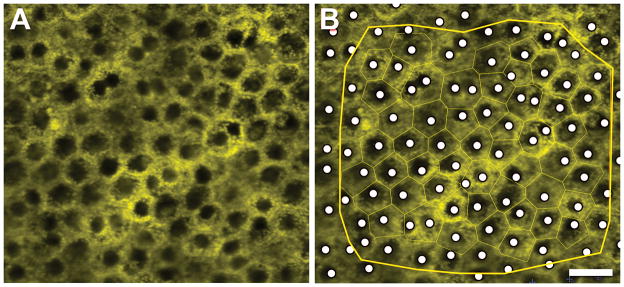
Figure 1. Computer-assisted manual marking of cell nuclei.
A Single image from z-stack before marking. B Single image from z-stack with Voronoi regions (surrogate for cells, thin green borders around cells) displayed and cell nuclei identified (white dots). All data within yellow edging were used for analysis. As previously described, (Ach et al., 2014) Voronoi regions (collection of regions that tessellate a plane) were generated from corresponding RPE cytoskeleton images (not shown). Scale bar: 20 μm.

