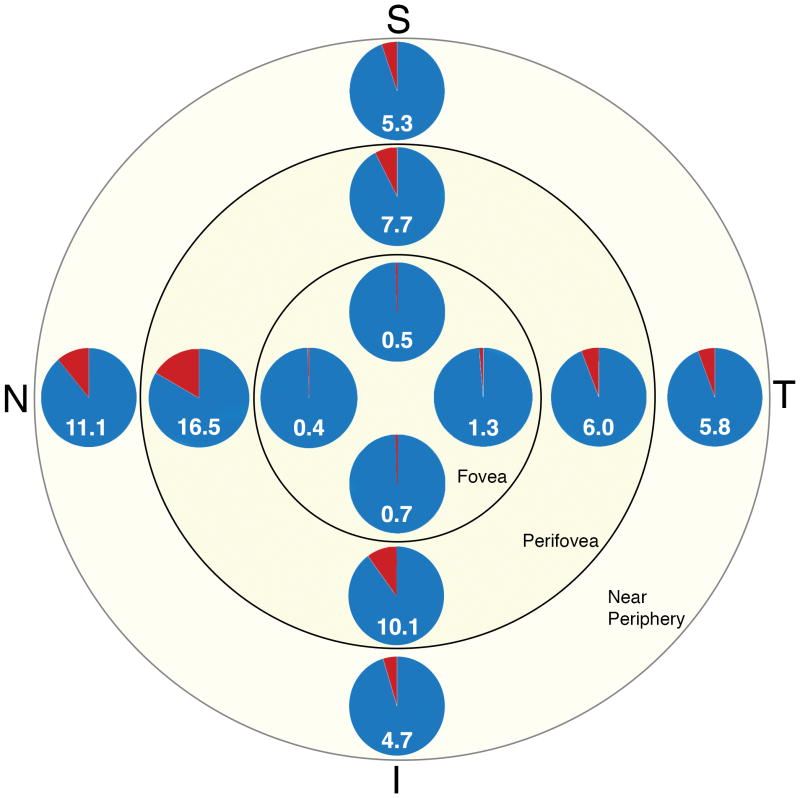
Figure 3. Percentages of multi-nucleate RPE cells as a function of eccentricity and quadrant.
The percentage of multi-nucleate RPE cells at each location, i.e., quadrant at each eccentricity, is presented in this multi pie illustration: as number and area (red) of each pie. Cells were pooled across all tissues. Quadrant (T = temporal, S = superior, N = nasal, I = inferior)

