
FIG. 1.
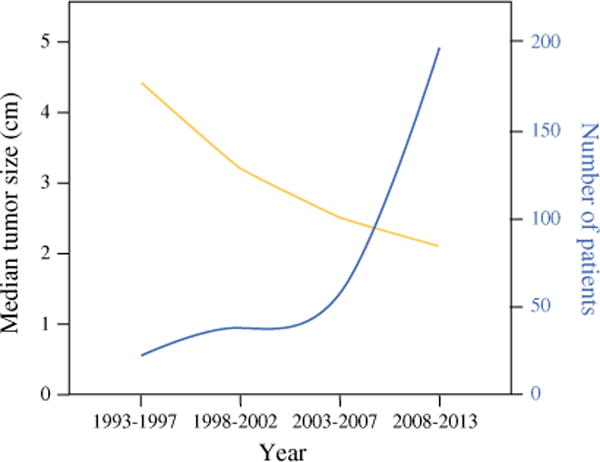
Distribution of tumor size over time in any patient whose PanNET was resected at MSKCC during the last two decades (n = 377). Yellow line represents the tumor size and blue line represents the number of patients
Official websites use .gov
A
.gov website belongs to an official
government organization in the United States.
Secure .gov websites use HTTPS
A lock (
) or https:// means you've safely
connected to the .gov website. Share sensitive
information only on official, secure websites.
Distribution of tumor size over time in any patient whose PanNET was resected at MSKCC during the last two decades (n = 377). Yellow line represents the tumor size and blue line represents the number of patients