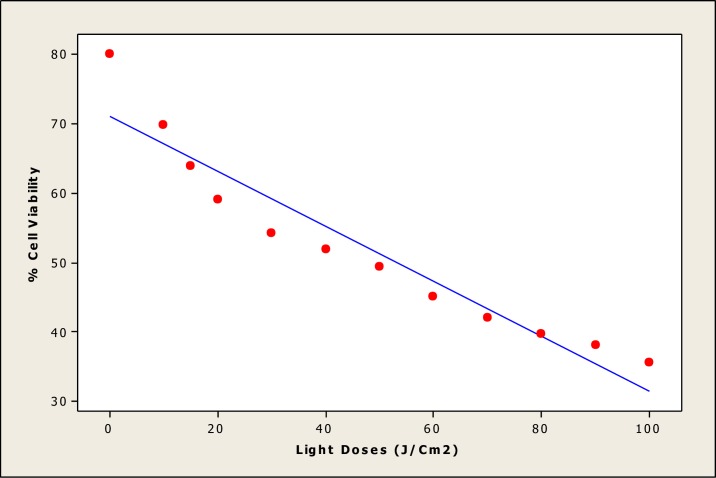
Fig 8. Linear calibration plot of nickel nanotubes (Ni NTs) (Light Doses (20–100 J/cm2).
In this figure, % cell viability after treatment with Ni NTs was plotted against light doses of 20–100 J/cm2, showing linear calibration and a linearity using regression equation analysis (Y = 71–0.396 X) of the calibration data (n = 5).

