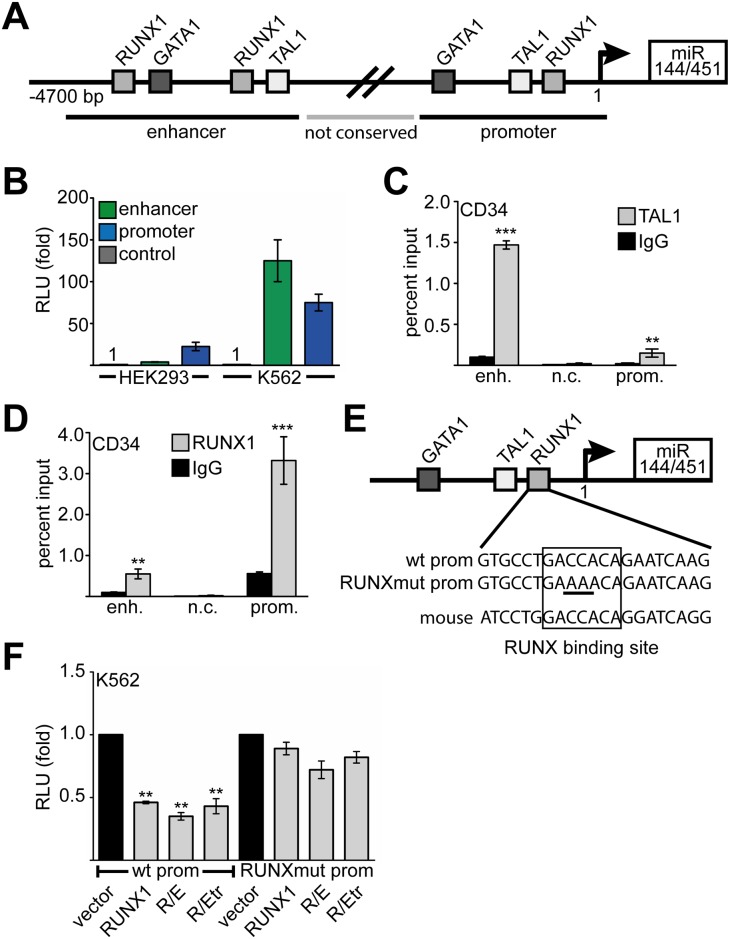
Fig 2. Regulation of miR144/451 expression.
(A) Schematic representation of the miR144/451 locus. The first 4700 bp of the 5’-region of miR144/451 are shown. Binding sites for hematopoietic transcription factors are found about 4500 bp upstream (enhancer) and in the proximal promoter region (promoter). A less conserved region (not conserved, n.c.) separates these regions. (B) Luciferase reporter gene experiment with constructs harbouring the enhancer or the promoter region of the miR144/451 cluster. Reporter constructs were transfected into HEK293 cells or K562 cells, respectively. Relative light units (RLU) are given as fold induction compared to values gathered with empty luciferase vector. Luciferase values were normalised for transfection variations by measuring the activity of a cotransfected beta-galactosidase expression vector. Error bars indicate the standard deviation from six independent transfections and measurements. (C) ChIP assay in primary hCD34+ cells shows binding of TAL1 predominantly to the enhancer region (enh.) as opposed to the promoter region (prom.). (D) ChIP assay in hCD34+ cells shows binding of RUNX1 to the promoter region (prom.) but only little to the enhancer region (enh.). (E) The human miR144/451 promoter contains a conserved binding site for RUNX1. The RUNX1 binding site was mutated by changing two base pairs in the core RUNX1 site. (F) Luciferase reporter assay using the wild type (wt prom) and the mutated (RUNXmut) miR144/451 promoters, respectively. Transfection of RUNX1, the RUNX1/ETO (R/E) fusion protein or the truncated RUNX1/ETO (R/Etr) repressed wild type (wt prom), but not the mutated promoter (RUNX1mut prom). Values are presented as fold change compared to the relative light units gathered upon transfection of the reporter gene and empty expression vector. Luciferase values were normalised for transfection variations by measuring the activity of a cotransfected beta-galactosidase expression vector. Error bars represent the standard deviation from six independent transfections and measurements. The P-value was calculated using Student’s t test. **P <0.01.

