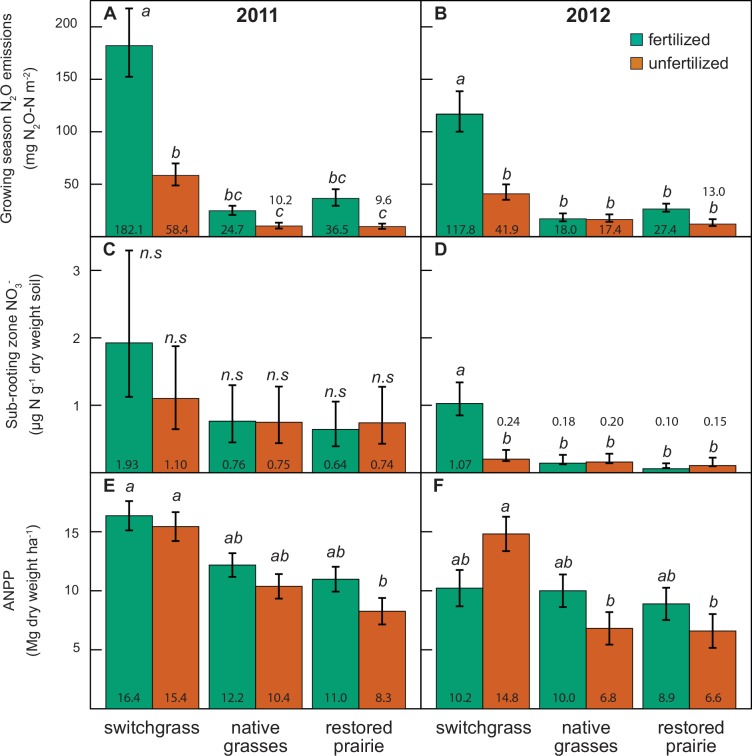
Fig 1. Average N losses and aboveground net primary productivity (ANPP) for each crop and fertilizer treatment in 2011 and 2012.
Within each panel, samples sharing a letter are not significantly different (P > 0.05), n.s. indicates no significant differences among samples. (a) Average total N2O emissions for the measurement period (May-September) are given as back-transformed geometric means ± standard error. (b) Average sub-rooting zone NO3- concentrations are given as back-transformed geometric means ± standard error. (c) Average aboveground productivity values are given as arithmetic means ± standard error.

