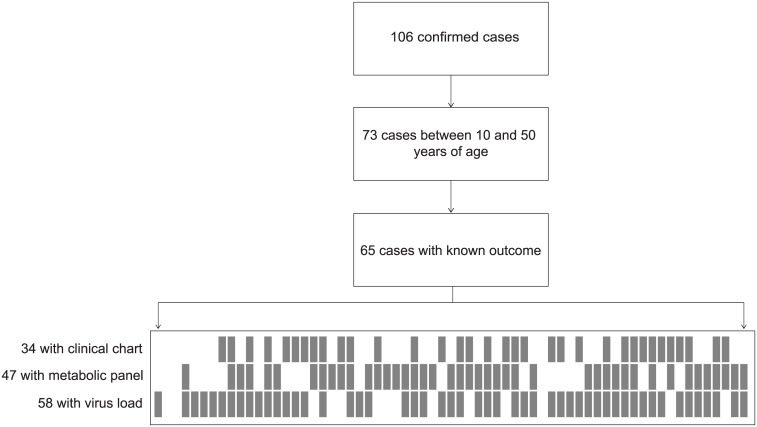
Fig 1. Case counts in the dataset.
The flowchart indicates the total number of positive, confirmed EVD in the original dataset, from which we took only those corresponding to patients with ages between 10 and 50. From those, only 65 have known outcome and could be used for analysis. In the bottom part of this diagram, the numbers of cases within the last 65 that contain clinical chart (24), metabolic panel (47), and virus load data (58) are represented by fill rectangles. The resulting missing data pattern illustrates that only a few patients had known information across all categories.

