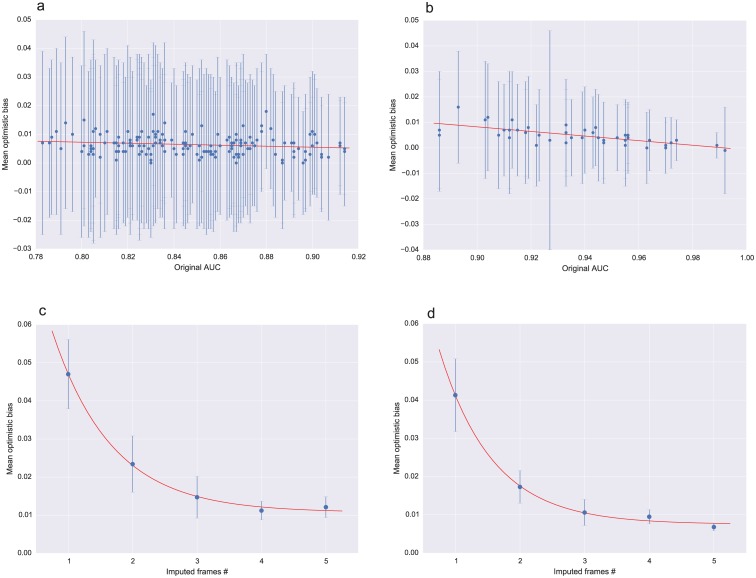
Fig 5. Optimistic-bias estimation.
The optimistic bias for the AUC scores of all top PCR (a) and non-PCR (b) predictors were estimated using bootstrap sampling method, averaging the difference between the AUC on the original data and the bootstrap samples over 100 iterations. The scatter plots show the original AUC scores for each model in the horizontal axis, the mean bias on the vertical axis, and the standard deviation of the bias as the error bar. Panels (c) and (d) show the dependency of the optimistic bias as a function of the number of imputed copies, for a logistic regression model that results of applying backward variable selection on the PCR (c) and non-PCR sets of variables (d). The backward selection algorithm was run 10 times for each number of imputed copies, and the mean bias over the 10 iterations is presented, with the standard deviation as the error bars. The bias is quite large when only one imputation is computed, but it decreases exponentially towards 0.01 as the number of multiple imputations increases. The red lines in all plots represent least squares fitted curves, using a linear function in (a, b), and an exponential curve in (c, d), thus highlighting the nature of the dependency of the optimistic bias as a function of the AUC, and the number of imputed copies.

