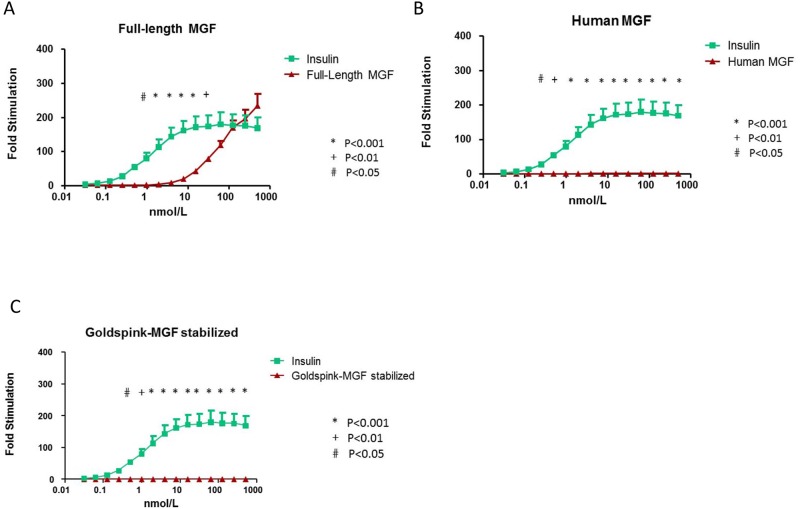
Fig 3. Stimulatory activity of the insulin receptor-A (IR-A).
A: Comparison of full-length MGF (red points and line) and insulin (green points and line). B: Comparison of Human MGF (red points and line) and insulin) (green points and line). C: Comparison of Goldspink-MGF (red points and line) and insulin (green points and line). Dose-response curves ranged from 0.03125 nmol/L to 500 nmol/L. For bioactivity measurements means ± SEM and signal-to-noise ratios are presented. A-C: Each point represents the mean value ± SEM of at least three independent experiments. P = P-value when comparing overall differences in fold stimulation between two ligands.

