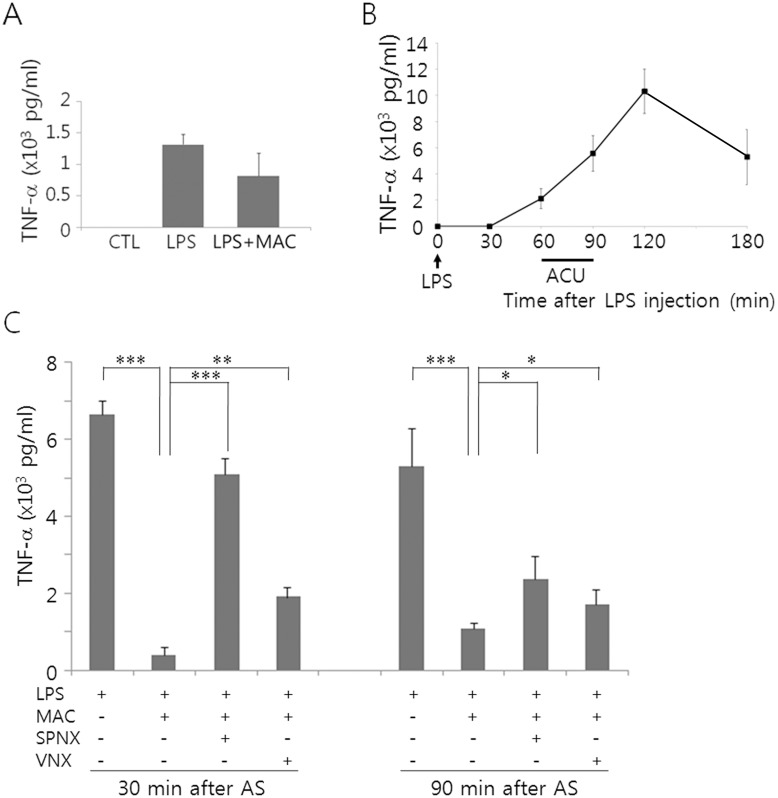
Fig 1. Profile of TNF-α production in the serum following AS in mice.
(A) Comparison of TNF-α levels among the non-treated control (CTL), LPS (60 μg/kg), and the LPS plus MAC. MAC stimulation was given 60 min after LPS administration for 30 min, and TNF-α levels in the serum were compared 30 min after the acupuncture. (B) Time-dependent changes of TNF-α in the mice injected with LPS (15 mg/kg). (C) Comparison of TNF-α levels among animal groups with different treatments as indicated in the Figure. Data are means ± SEM [number of animals in each group = 3 in (A) and 4 in (B and C)]. *p<0.01, **p<0.01, ***p<0.001 (one-way ANOVA).

