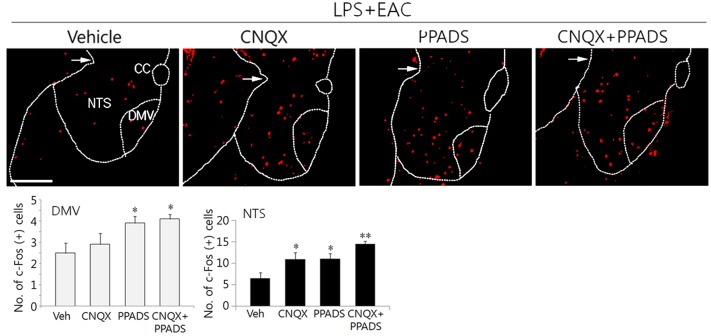
Fig 4. Regulation of c-Fos induction in the DVC by CNQX and PPADS.
Following MAC and EAC in combination with focal administration of CNQX and/or PPADS into the DVC area, transverse sections through the caudal portion of the brainstem were subjected to immunofluoresence staining analyses for c-Fos production. Upper images are the representatives showing c-Fos signals in the brain sections and lower graphs show the quantitation of the protein signals in the field. Mean ± SEM (n = 4 independent experiment). *p<0.05 and **p<0.01 vs. vehicle control (one-way ANOVA). The scale bar is 100 μm.

