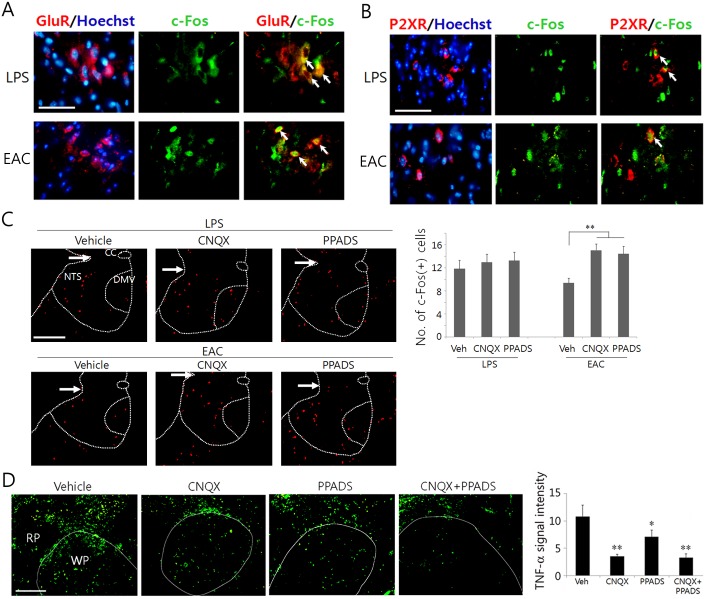
Fig 5. Identification of cells positive to glutaminergic and purinergic receptors and blockade effects of receptors on c-Fos and TNF-α production.
Following LPS (180 min later) or EAC (90 min later), transverse sections through the caudal portion of the brainstem were used for immunofluorescence staining for GluR2/3 and c-Fos (A), P2X2 receptor (red) and c-Fos (green), and c-Fos. In (D), animals were treated with LPS and EAC, and drugs were also injected as indicated in the figure. Arrows in (A) and (B) denote the cells coexpressing GluR2/3 and c-Fos and P2X2 and c-Fos respectively. Arrows in (C) denote the approximate NTS boundary between two hemispheres. Quantifications of the protein signals are shown in (C) and (D). Mean ± SEM (n = 4 independent experiment). *p<0.05 and **p<0.01, *** vs. vehicle control (one-way ANOVA). The scale bars in (A-D) are 100 μm.

