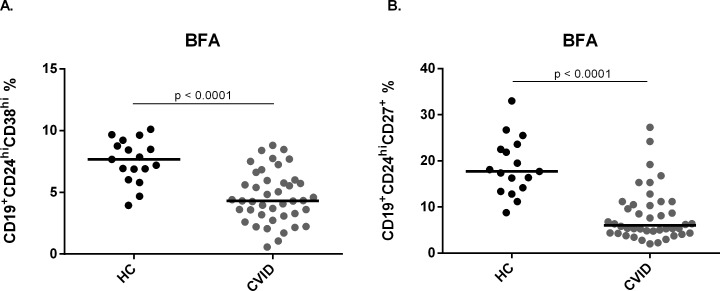
Fig 1. Frequency of CD24hiCD38hi and CD24hiCD27+ cells in healthy controls and CVID patients.
B cell subsets were determined by the expression of surface markers CD24, CD38 and CD27, and analyzed by flow cytometry. Scatter plots show the percentages of B cell subsets (A) CD19+CD24hiCD38hi and (B) CD19+CD24hiCD27+ in peripheral blood of 17 healthy controls (HC) and 42 CVID patients. Bars represent mean value. P values were calculated by Mann-Whitney test.

