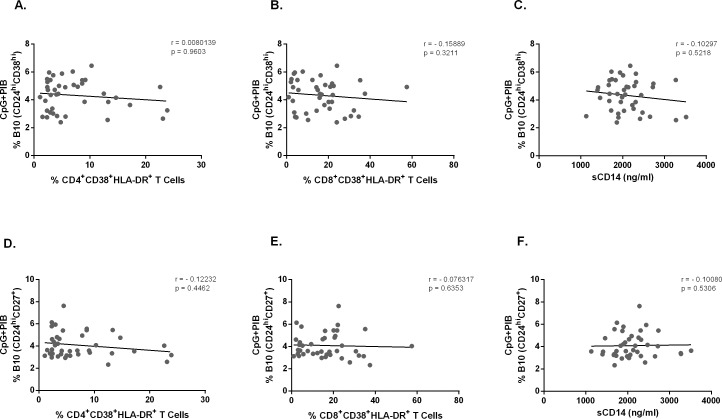
Fig 6. Correlation analysis of B10 cells and chronic activated T cells.
The expression of intracellular IL-10 and surface markers CD24, CD38 and CD27 were determined by flow cytometry after in vitro stimulation of PBMC for 5h with CpG + PIB. Chronic activated T cells were determined in PBMC by the expression of surface markers CD4, CD8, CD38 and HLA-DR without stimulation and analyzed by flow cytometry. sCD14 levels in plasma were determined by ELISA. Correlation of CD19+CD24hiCD38hi IL-10+ cells with chronic activated (A) CD4+ and (B) CD8+ T cells in 43 CVID patients. Correlation of CD19+CD24hiCD27+ IL-10+ cells with chronic activated (D) CD4+ and (E) CD8+ T cells in 43 CVID patients. Lines represent linear regression analysis. Correlation of CD19+CD24hiCD38hi IL-10+ (C) and CD19+CD24hiCD27+IL-10+ (F) B cells with plasma levels of sCD14 in 41 CVID patients. Lines represent linear regression analysis. R and P values were calculated by Spearman’s rank order correlation test.

