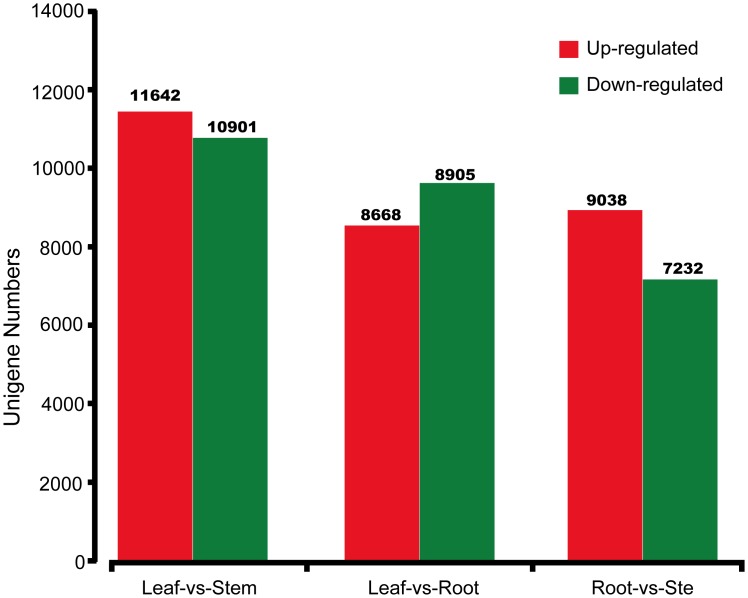
Fig 6. Differentially expressed genes profiling of three libraries of leaf, root and stem of Atractylodes lancea.
The red and green columns indicate up- and down-regulated genes in comparisons of leaves, stem and root libraries in A. lancea. FDR≤0.05 and the absolute value of Log2FC Ratio ≥1 were used as the threshold to judge the significance of gene expression difference from transcriptome data.

