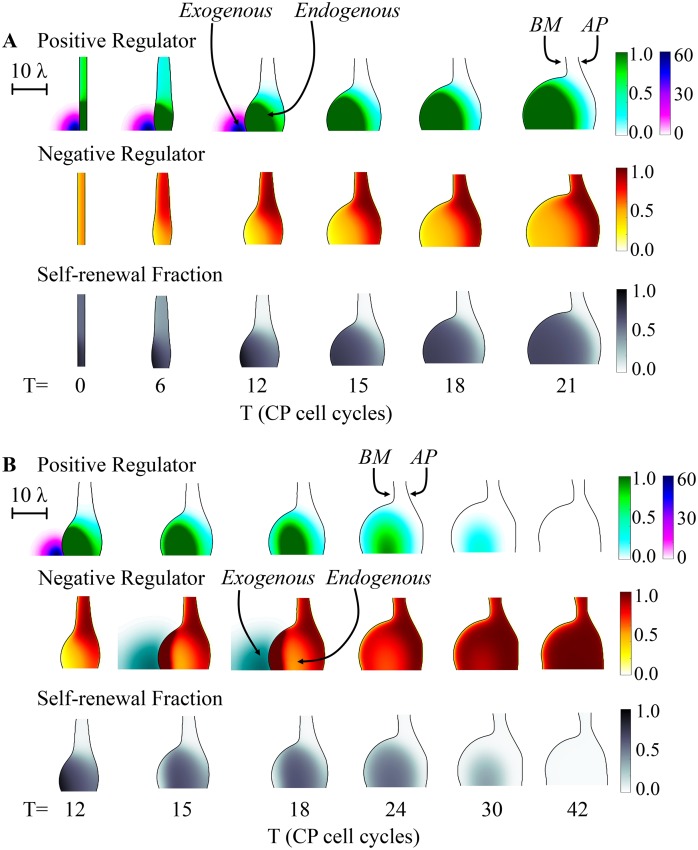
Fig 5. Effect of transient application of positive and negative regulators.
(A) The spatial development of a three-stage lineage is modeled as in Fig 4, except that the exogenous source of F is removed after the 12th CP cell cycle. The spatiotemporal distributions of the positive regulator F (exogenous: purple; endogenous: green), the negative regulator G, and the CP self-renewal fraction P are shown in the three panels. The results show that the transient stimulus is sufficient to drive the CP self-renewal fraction above a critical threshold, beyond which bud growth becomes self-sustaining. (B) In this example, the simulation proceeds identically to panel A for the first 15 CP cell cycles, after a localized exogenous source of G is added for three cell cycles, and then removed. The result is an abrupt and sustained arrest of growth. Spatiotemporal distributions of F, G and P are plotted as in panel A, with an additional dark green scale added for exogenous G. Scale bars in A and B are in units of the diffusional length of feedback factor G (λ), i.e. approximately 50 μm. See S1 Table for a complete list of parameter values.

