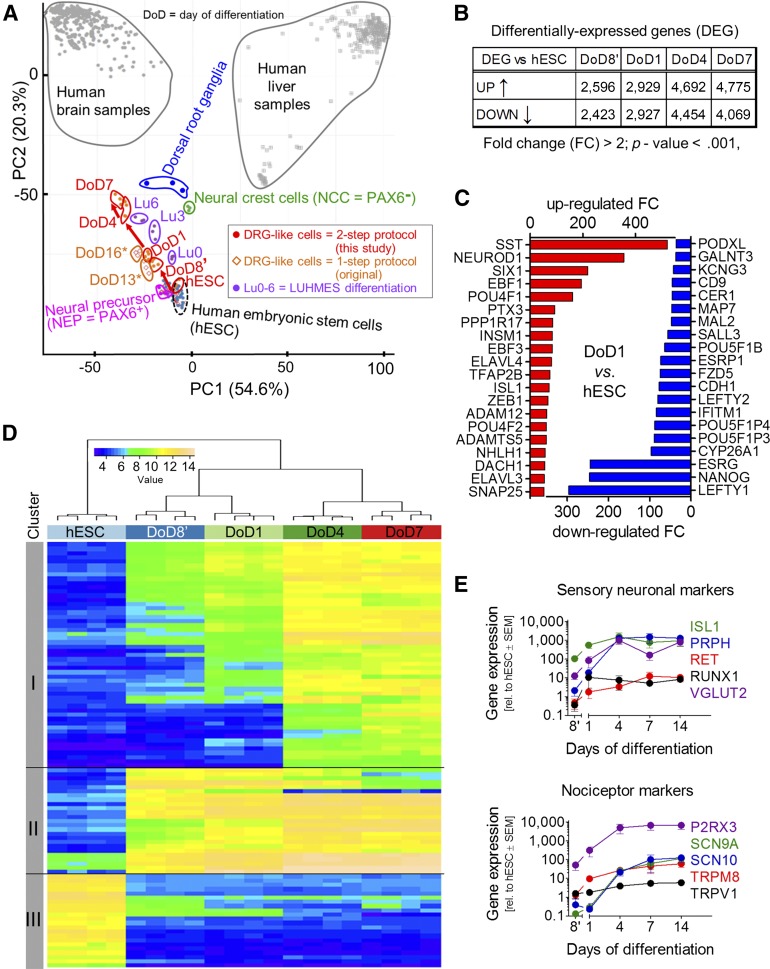
Figure 3.
Differentiation tracking by transcriptome analysis of iDRG cells. (A): Samples were obtained at different developmental stages for whole transcriptome analysis; data are displayed as a principal component analysis (PCA) map, together with legacy data from cell cultures or from human dorsal root ganglion, brain, and liver tissue. The red arrow indicates the cell differentiation track of the two-step iDRG cell differentiation protocol. Note: DoD7 of the two-step protocol is 16 days older than hESCs (i.e., roughly corresponding to DoD16* of the one-step protocol in differentiation time). (B): Number of regulated genes over time. (C): Top 20 significantly upregulated (red) and downregulated (blue) genes. (D): Hierarchical clustering analysis of the top 100 genes with the highest variance during peripheral neuronal differentiation. (E): Relative gene expression during differentiation (n = 4–6). Abbreviations: DoD, day of differentiation; FC, fold change; hESC, human embryonic stem cell; iDRG, immature dorsal root ganglia neuron; PC1, principal component 1; PC2, principal component 2; rel., relative.

