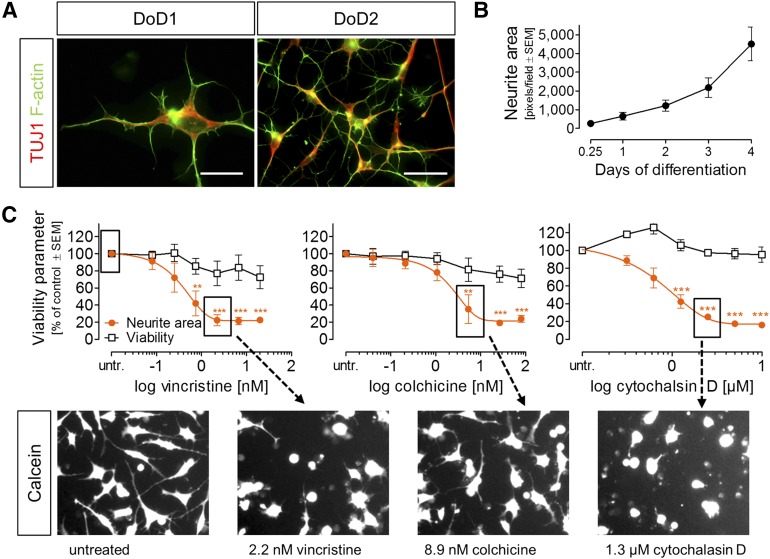
Figure 4.
Characterization and quantification of neurite growth of early iDRG cells. (A): Immunocytochemical characterization of early neurites; labels are color keyed to images. (B): Quantification of neurite area over time (mean ± SEM; n = 5). (C): Effects of vincristine, colchicine, and cytochalasin D on neurite area and viability under PeriTox test conditions (mean ± SEM; n = 3–4) and exemplary sample images (**, p < .01; ***, p < .001). Scale bars = 20 µm (A, left) and 50 µm (B, right; C). Abbreviations: DoD, day of differentiation; untr., untreated.

