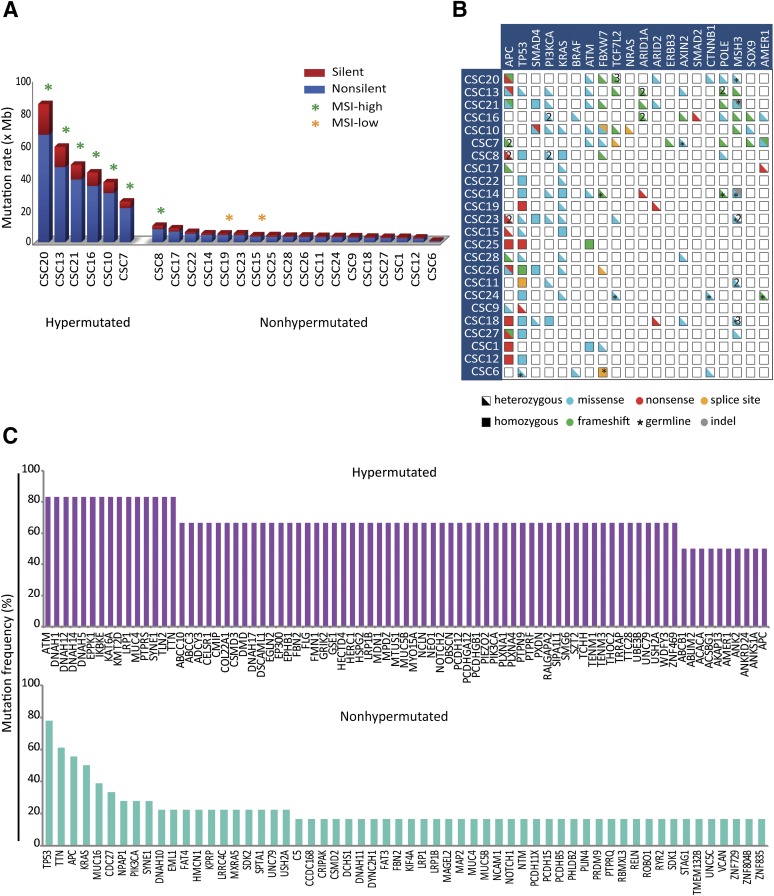
Figure 2.
Whole exome sequencing (WES)-based mutation profiling of cancer stem cells (CSCs). (A): WES analysis allows estimation of CSC mutation rates, distinguishing hypermutated (more than 10 mutations per Mb) and nonhypermutated (fewer than 10 mutations per Mb) lines. High- and low-grade MSI is indicated by green and orange asterisks, respectively. Both silent (blue) and functionally relevant (red) somatic variants are reported. (B): An OncoPrint (cBioPortal, New York, NY, http://www.cbioportal.org) showing functionally relevant intragenic lesions in recurrently mutated genes for individual CSC lines. Half boxes and full boxes represent heterozygous and homozygous variants, respectively; colors are used to specify the type of mutation. Asterisks indicate germline mutations; multiple hits affecting the same gene are indicated by numbers. (C): Graphs showing the most frequently mutated genes in hypermutated (upper graph) and nonhypermutated (lower graph) CSC lines. Abbreviation: MSI, microsatellite instability.

