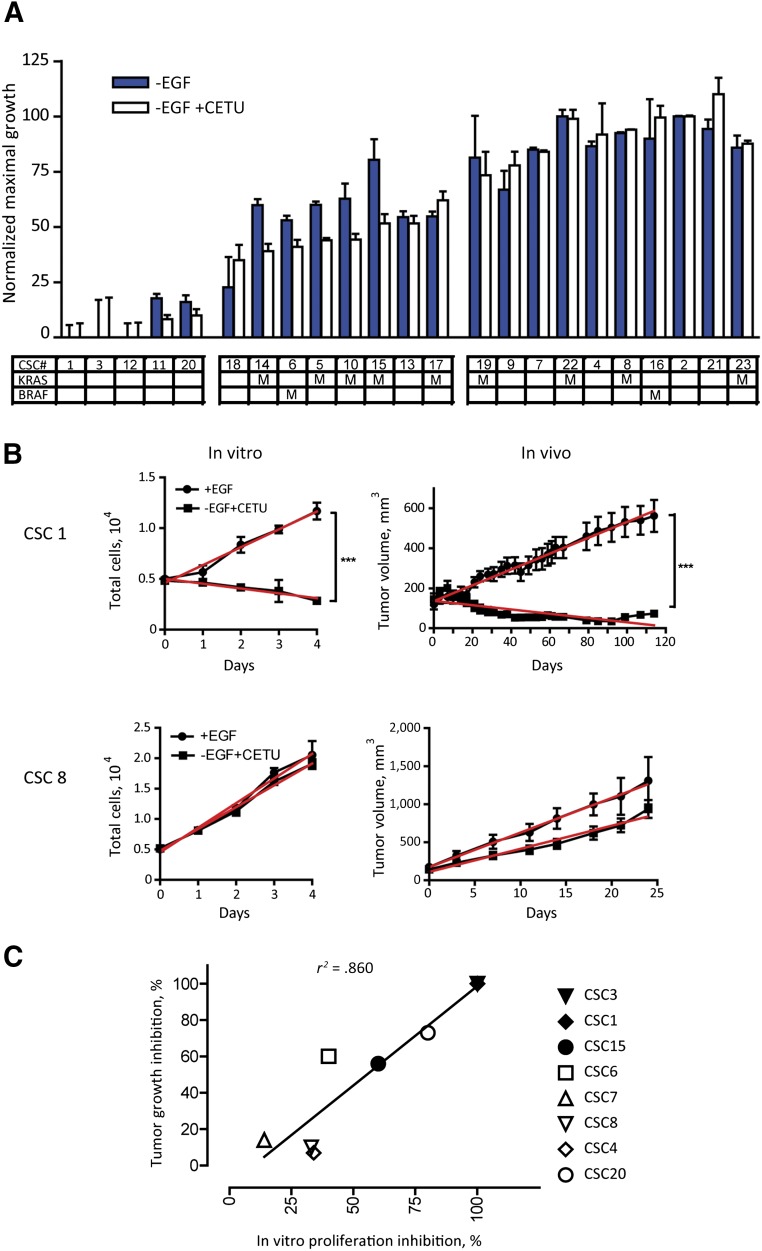
Figure 4.
Effect of epidermal growth factor receptor inhibition on CSC spheroids and matched xenografts. (A): CSC sensitivity to cetuximab in EGF-deprived cultures. Cell growth is expressed as the percentage of maximal growth occurring in complete CSC medium (i.e., in the presence of 20 ng/ml exogenous EGF). Mutational status for KRAS and BRAF is indicated for each CSC line. Spheroid culture viability was assessed at 72 hours by the CellTiter-Glo luminescent cell viability assay (Promega), as described in Materials and Methods. Data represent the average of three independent experiments ± SEM. (B): Time course of cetuximab inhibition on the growth of spheroid cultures (left panels) and of tumor xenografts (right panels) in representative CSC 1 (KRASwt) and CSC 8 (KRASmut). Spheroid viability was assessed as in (A); data represent the average of three independent experiments ± SEM. CSC subcutaneous xenografts were generated as described in Materials and Methods. After tumor establishment, mice were treated with 10 mg/kg cetuximab intravenously twice weekly. Data represent the average of 6–10 tumors per group. For all the tests, statistical significance was calculated by two-tailed Student’s t test. Linear regression is shown in red. For each test, inhibition can be expressed as the ratio of slopes (treated to untreated). (C): Plot of cetuximab-induced growth inhibition in spheroids versus xenografts calculated for eight CSC lines (panel B; supplemental online Fig. 5). Cetuximab inhibition of CSC spheroids strongly correlates with xenograft reduction (r2 = .860). All calculations were done with the GraphPad Prism software. Abbreviations: CETU, cetuximab; CSC, cancer stem cell; EGF, epidermal growth factor.

