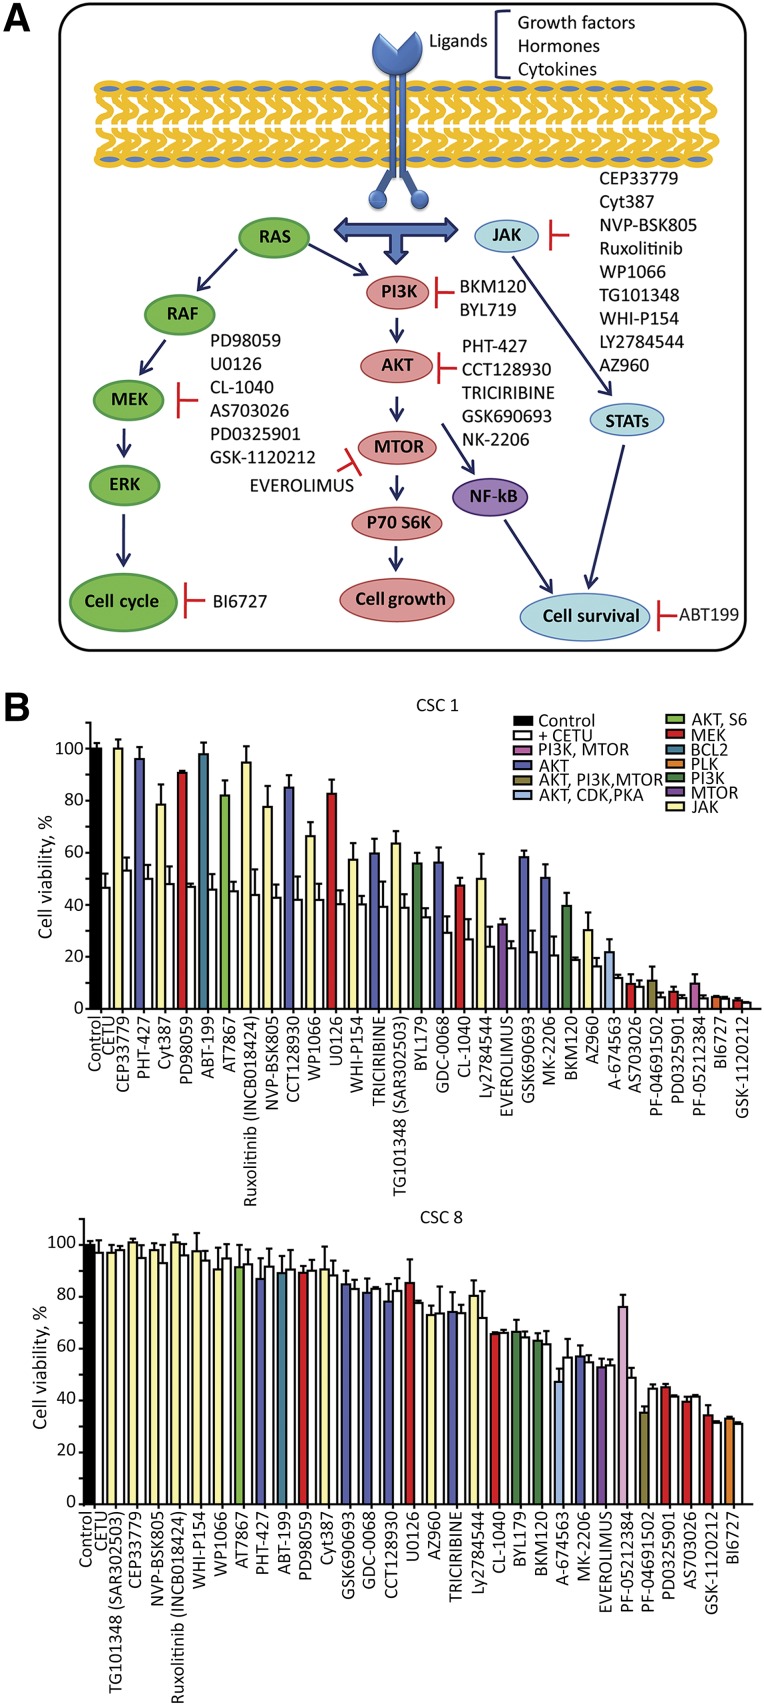
Figure 7.
Targeted pathway inhibition in anti-epidermal growth factor receptor (EGFR)-sensitive and -resistant CSCs. (A): Schematic representation of EGFR downstream pathway effectors. Small molecule inhibitors directed to relevant pathway effectors identified by reverse phase proteomic array are further specified in supplemental online Table 5. (B): Drug screening performed on dissociated spheroid cells highly responsive (CSC 1) or resistant (CSC 8) to anti-EGFR inhibition. Cells were treated as described in the Materials and Methods, viability was assessed with the CellTiter-Glo assay (Promega) and expressed as the percentage of dimethyl sulfoxide-treated control cells (black bar). Bars relative to inhibitor-treated cells were assigned different colors according to the pathway inhibited. Each compound was tested as a single agent at a 100 nM concentration (colored bars) or in combination with 100 μg/ml cetuximab (white bars). Samples were ordered on the basis of their sensitivity to the combination of cetuximab plus targeted inhibitor. Data represent the average of three independent experiments ± SEM. Abbreviations: CETU, cetuximab; CSC, cancer stem cell.

