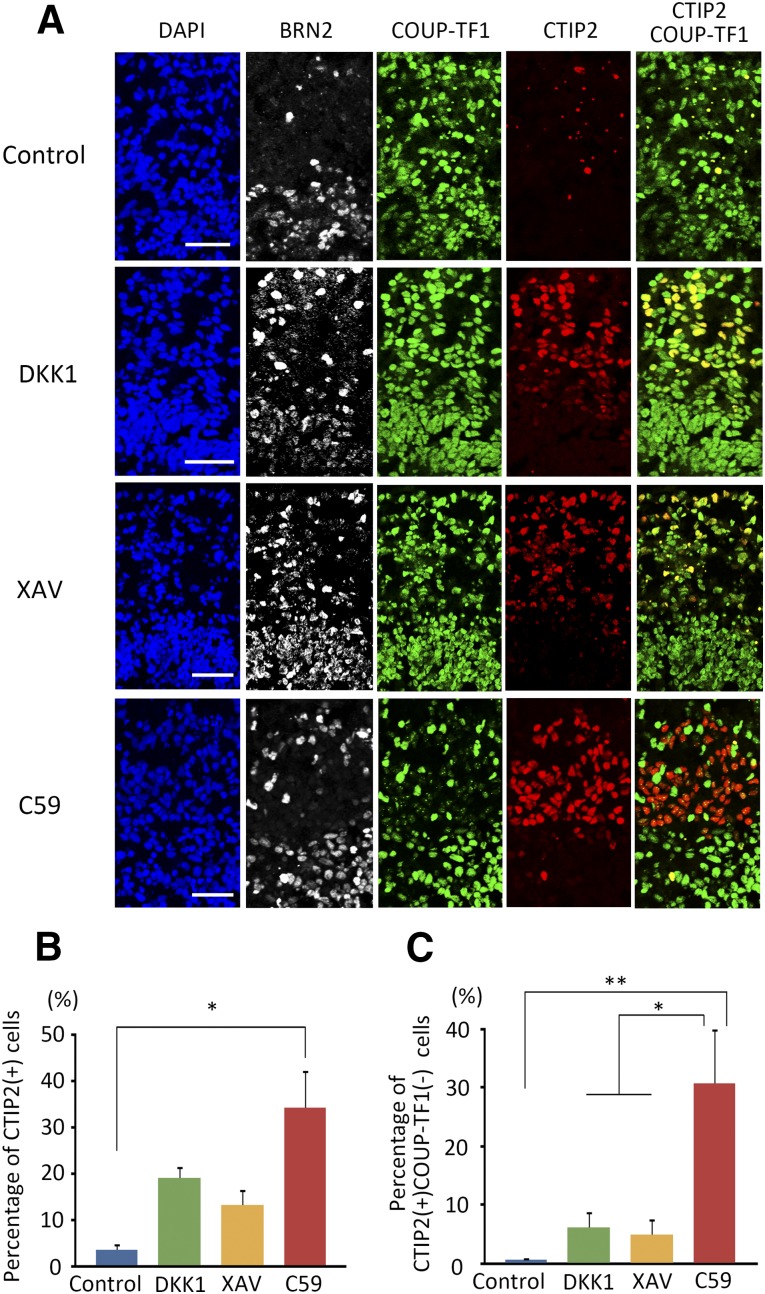
Figure 3.
Comparison of CTIP2-expressing cells on day 46. (A): Immunocytochemistry for layer and region markers on day 46 using the ventricular and subventricular zone marker BRN2 (white), caudal marker COUP-TF1 (green) and layer V marker CTIP2 (red). (B, C): Percentages of CTIP2 (B) and CTIP2+/COUP-TF1− (C) cells were investigated for each WNT inhibitor. Differences were considered significant by ANOVA and Tukey’s test (n = 3). ∗, p < .05; ∗∗, p < .01. Scale bars = 50 μm. Abbreviations: ANOVA, analysis of variance; C59, WNT-C59; DAPI, 4′,6-diamidino-2-phenylindole; XAV, XAV939.

