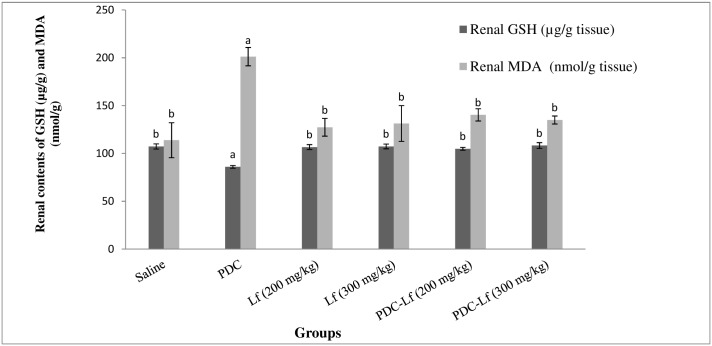
Fig 2. Renal contents of oxidative stress markers; GSH and MDA.
Saline, rats treated with Saline; Lf, rats treated with lactoferrin; PDC, rats treated with potassium dichromate; PDC-Lf, rats treated with potassium dichromate and lactoferrin. a Significantly different from normal group at p < 0.05. b Significantly different from PDC at p <0.05.

