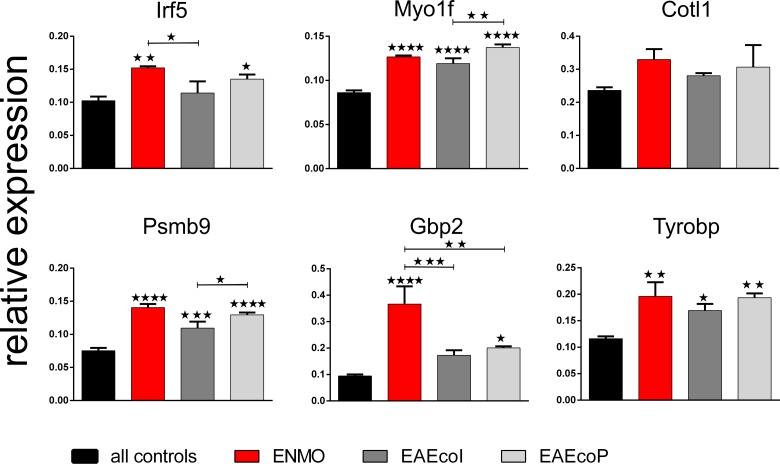
Fig 5. Confirmation of differentially expressed genes by qPCR.
Shown here are the mean relative expression values (+/-SEM) of different gene products in relation to the house keeping gene glyceraldehyde-3-phosphate-dehydrogenase (GAPDH) of rats receiving T cells and NMO-IgG (ENMO, n = 3), T cells and subcuvia as control IgG (EAEcoI, n = 3) or T cells and PBS (EAEcoP, n = 3) in comparison to “all controls” (mean value of rats injected with NMO-IgG only (n = 2), subcuvia as control IgG only (n = 3) and PBS only (n = 3). Unless otherwise indicated, statistically significant differences of the experimental groups are calculated in relation to “all controls”. (*p<0.05, **p<0.01, ***p<0.001, ****p<0.0001, one-way ANOVA with Bonferroni multiple comparisons test).

