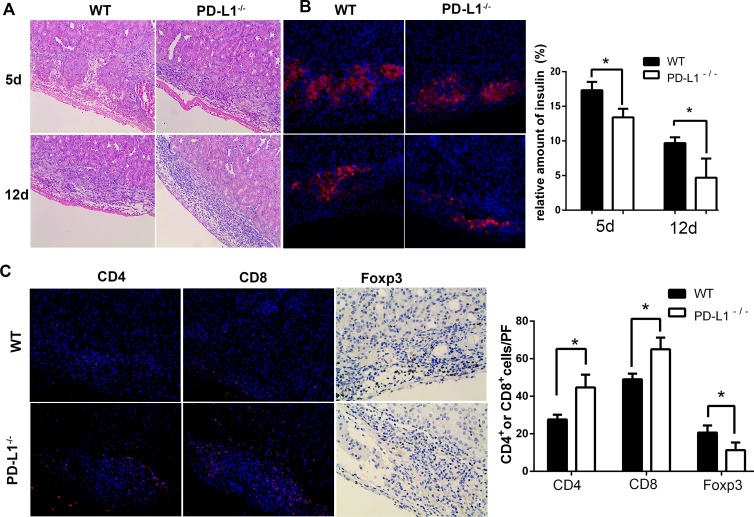
Fig 3. The residual β cells and infiltration of inflammatory cells at 5 and 12 days post-transplantation.
Representative images of allografts in the renal capsules are shown (A) Grafts were harvested and stained for insulin with H&E. (B) Immunofluorescence staining for insulin (in red) in islet grafts. The right panel shows the relative quantification of the insulin signal analysed with Image-Pro Plus 6.0. Less insulin secretion was observed in the PD-L1-deficient group at both 5 and 12 days post-transplantation. (C) Immunofluorescence staining for inflammatory cells (CD4+ and CD8+, in red; Foxp3+, in brown) in islet grafts. Nuclei were counterstained with DAPI (in blue). Magnification is 200× (* P<0.05).

