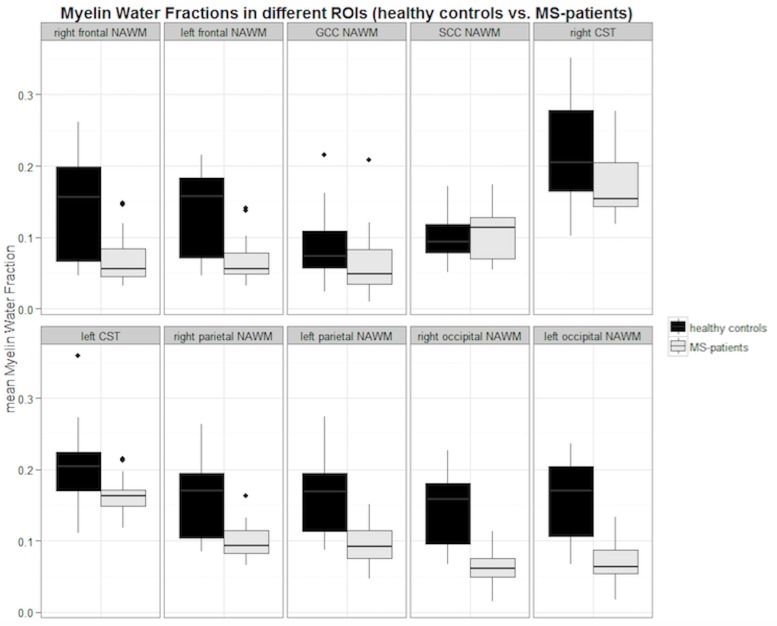
Fig 3. Boxplots of mean MWFs in the NAWM of all MS-patients compared to WM of healthy controls.
Black boxes indicate the mean myelin water fraction (MWF) of healthy controls (HC) and grey boxes display the mean MWF of MS-patients in the specific Region of Interest (ROI) localization. NAWM = normal appearing white matter; WM = white matter of healthy controls; GCC = genu of corpus callosum; SCC = splenium of corpus callosum; CST = corticospinal tract.

