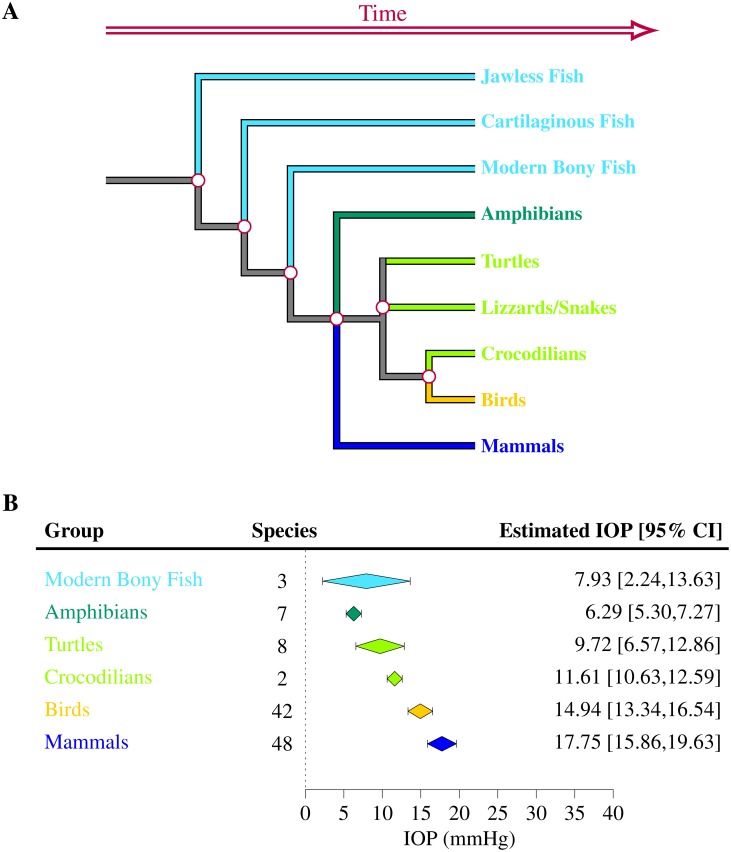
Fig 10. Simplified phylogenic tree of the vertebrate family (A) and estimated IOP within each group (B).
The diagram was not plotted to scale. The sample size N and the 95% confidence interval (CI) is indicated for each group. The estimated IOP appears to have increased with the evolution of terrestrial animals.

