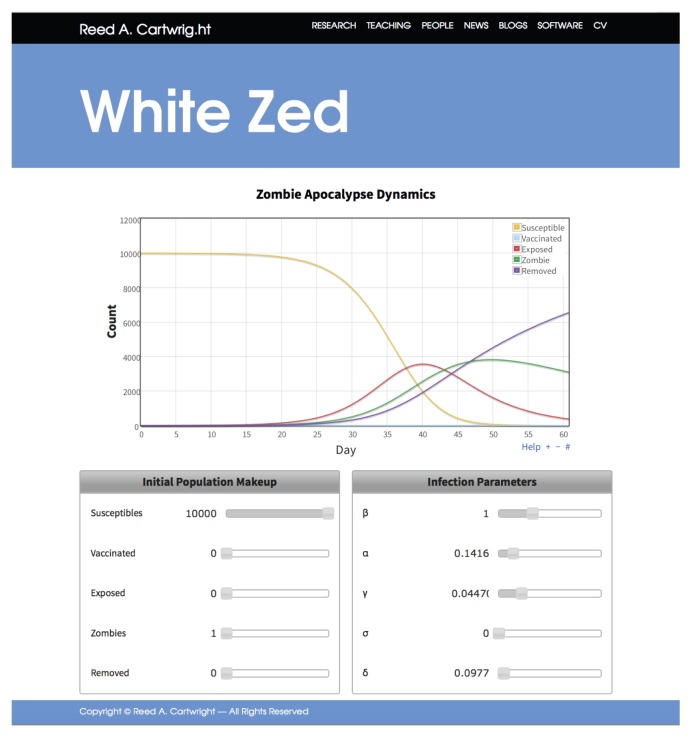
FIGURE 2.
Screenshot of the White Zed simulation website. The graph displays population dynamics of a zombie apocalypse. The left control panel allows users to specify the population makeup at the beginning of the simulation, while the right control panel allows users to specify the infection parameters of the disease.

