
Figure 3.
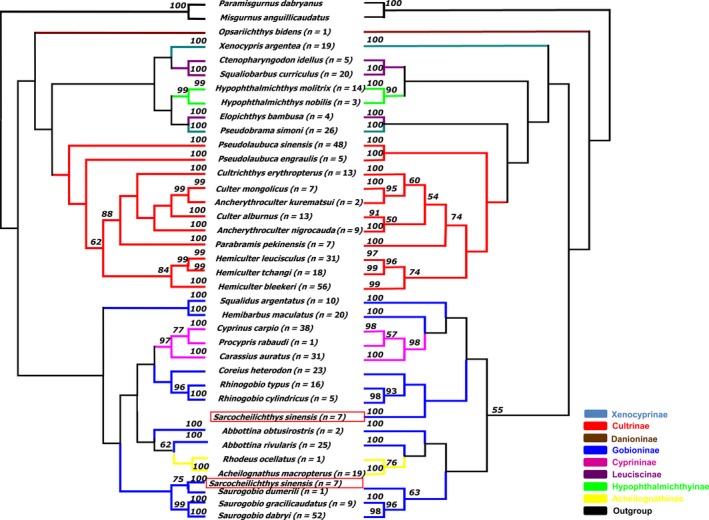
Neighbor‐joining tree constructed with MEGA based on the K2P model (left) and the maximum‐likelihood tree constructed with PhyML (right). Bootstrap values greater than 50 are shown. n: the number of samples. Each color represents a subfamily.