
Figure 4.
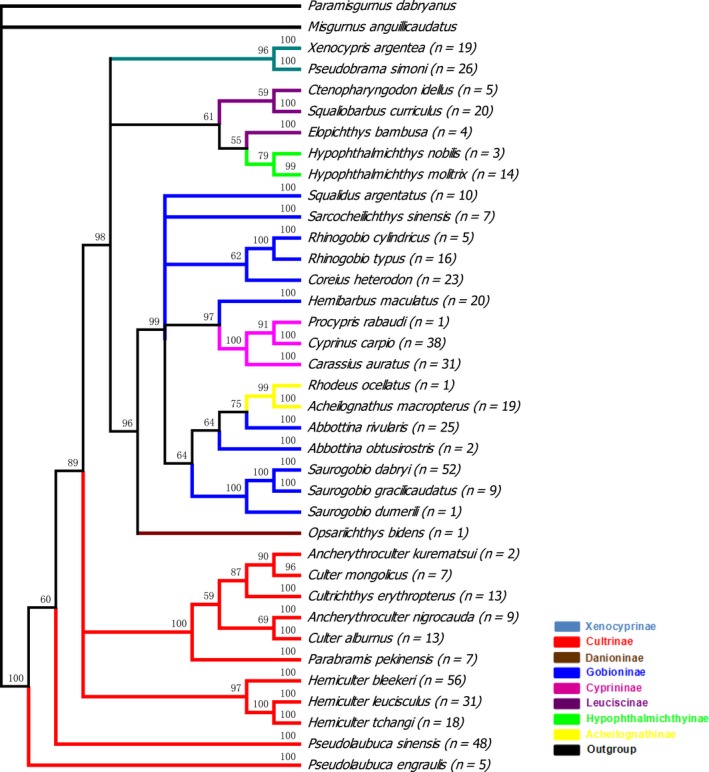
Bayesian tree constructed with MrBayes. Bootstrap values greater than 50 are shown. n: the number of samples. Each color represents a subfamily.
Official websites use .gov
A
.gov website belongs to an official
government organization in the United States.
Secure .gov websites use HTTPS
A lock (
) or https:// means you've safely
connected to the .gov website. Share sensitive
information only on official, secure websites.
Bayesian tree constructed with MrBayes. Bootstrap values greater than 50 are shown. n: the number of samples. Each color represents a subfamily.