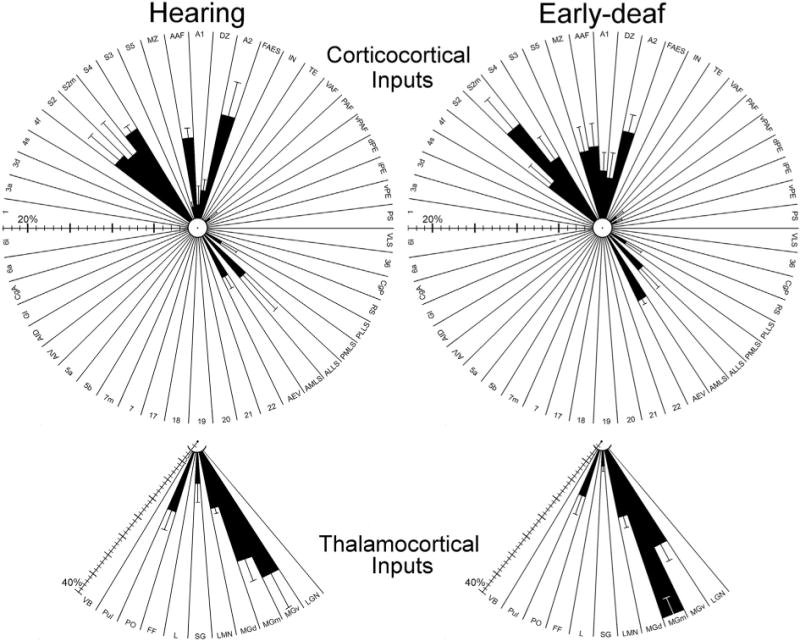
Fig. 12.

Summary of cortical (top) and thalamic (bottom) connections with FAES in hearing (left) and early-deaf (right) animals. Shown are results (black bars = mean ± se) for every examined cortical and thalamic area (abbreviations defined in abbreviation list); regions with <1% of total projection could not be effectively plotted. Note the scale bars for cortical and thalamic connections are different, since they are based on totals from different populations of neurons. These radial-plots of the major results reveal a ‘footprint’ of the patterns and proportions of connections with FAES that are very similar for hearing and early-deaf animals alike. Hence, crossmodal plasticity in the FAES following deafness cannot be explained by changes in sources of afferent projections.
