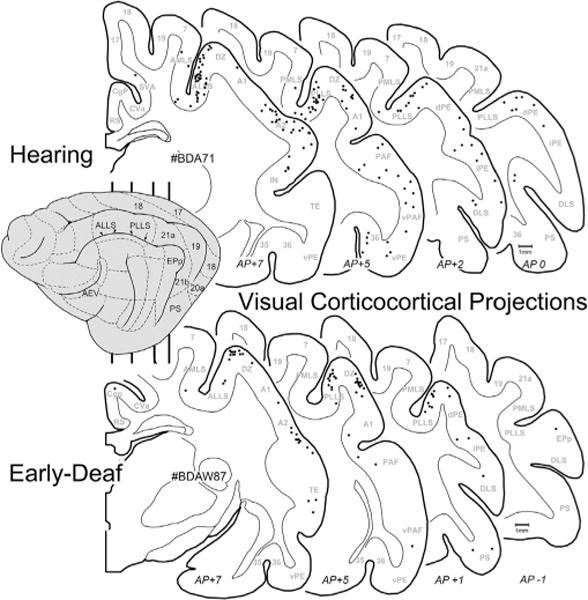
Fig. 4.

Visual corticocortical projections to FAES. On the lateral view of the cat cortex (left) the major visual regions are depicted (for abbreviations, see abbreviation table), and the vertical lines indicate the approximate levels from which the depicted coronal sections were taken (approximate anterior-posterior levels listed at bottom). Sections through the cortex of a hearing (top; case BDA71) and an early-deaf (bottom; case BDAW87) animal are outlined with the grey–white border and subcortical nuclei plotted; each dot represents one retrogradely labeled neuron from the FAES injection. Note that the most consistently labeled of the visual cortical areas were the ALLS/PLLS regions for both hearing and deaf cases.
