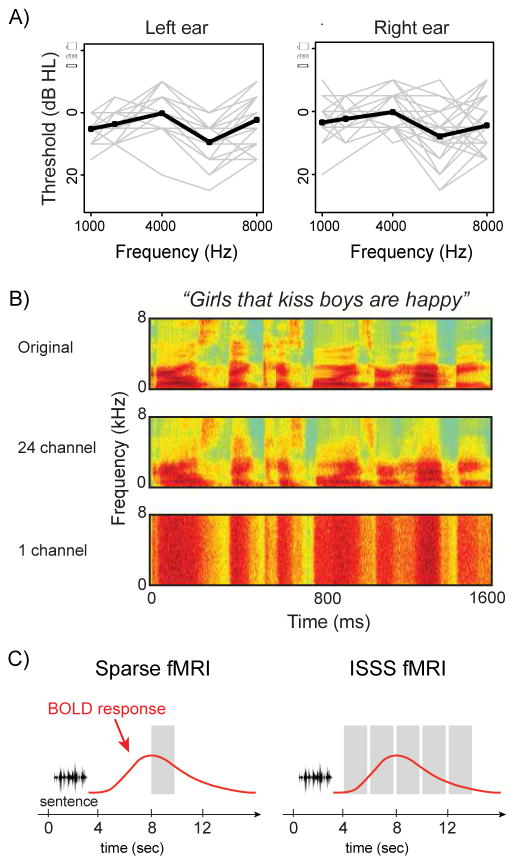
Figure 1.
A. Pure-tone hearing acuity for participants’ left and right ears. Individual listeners’ profiles are shown in gray lines, with the group mean in black. B. Spectrograms of a representative sentence in the three acoustic conditions tested: unprocessed speech (acoustically rich), vocoded with 24 channels (acoustically less detailed but fully intelligible), or vocoded with 1 channel (unintelligible). C. Schematic comparison between a traditional sparse fMRI protocol and the ISSS protocol used in the current study.

