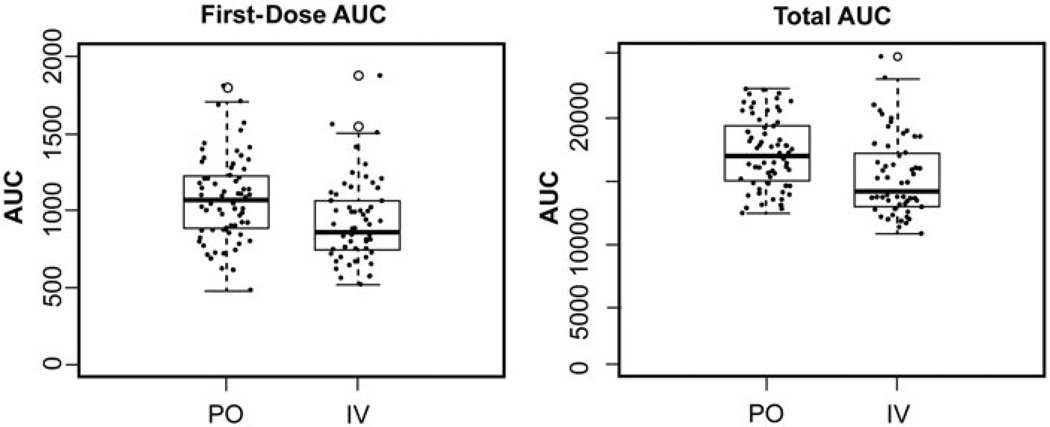
Figure 1.
Busulfan exposure by route of busulfan administration. In these box-and-whisker plots, the thick horizontal line represents the median area-under-the-concentration-curve (AUC), and the thin black lines represent the lower and upper quartiles. The whiskers demonstrate 1.5× the interquartile range, and outliers beyond the whiskers are individually plotted as open circles. The raw data are overlaid (solid dots) on this plot. The left graph represents oral (PO) and intravenous (i.v.) busulfan separately plotted versus first-dose AUC (goal range of 800–1400 µmol*min/L). The right graph demonstrates PO and i.v. busulfan separately plotted versus calculated total cumulative AUC (goal range of 12 800–22 400 µmol*min/L). The median first-dose and total cumulative AUC were significantly higher in the PO busulfan group (first-dose AUC, p = 0.001; total cumulative AUC, p = 0.0001).

