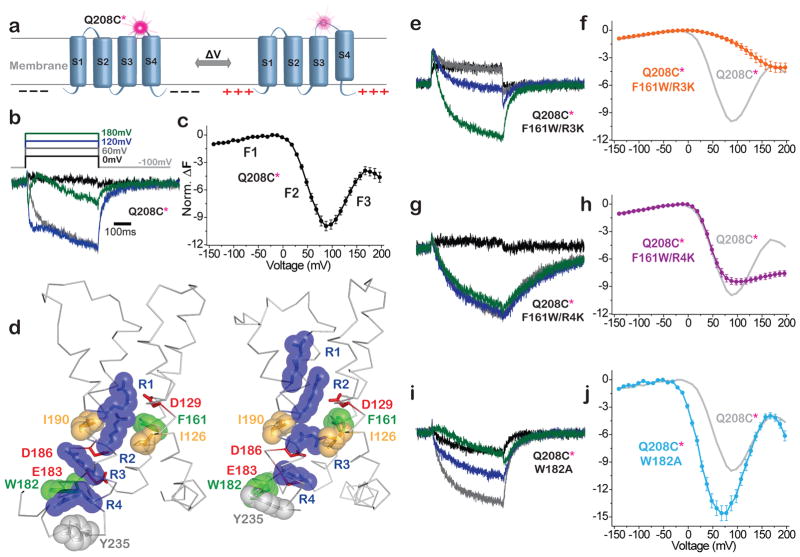
Figure 4. VSD mutants stabilize discrete VSD conformations.
a) Schematic of voltage clamp fluorometry with TMRM at Q208C (208*) in S3–S4 loop. b,c,e–j) Deplarization-induced ΔF traces (b,e,g,i) and corresponding average F-V relations (c,f,h,j) calculated from fluorescence measured at end of each 500ms step (mean + s.e.m.). b,c) WT (Q208C*) (n=7) has three fluorescence components: F1, F2 and F3. d) Crystal structures of VSD from WT Ci-VSP (resting at zero voltage; S4 “down”; PDB: 4G80) and the R217E mutant (activated at zero voltage; S4 “up”; PDB: 4G7V)43. Deduced activation transition moves R1–R4 (blue) outward (up), with R2 crossing hydrophobic plug (I126, I190 and F161) and R4 crossing hydrophobic residue W182. e,f) F161W/R3K (n=6) shifts F2 to more positive voltage (i.e. stabilizes conformation between F1 and F2). g,h) F161W/R4K (n=5) has relatively unperturbed F1 and F2 components, but F3 is suppressed (i.e. stabilizes the conformation between F2 and F3. i,j) W182A (n=7) shifts F2 and F3 to more negative voltages. Amplitudes of mutant F-Vs (f,h,j) normalized to WT using the F1 component.

