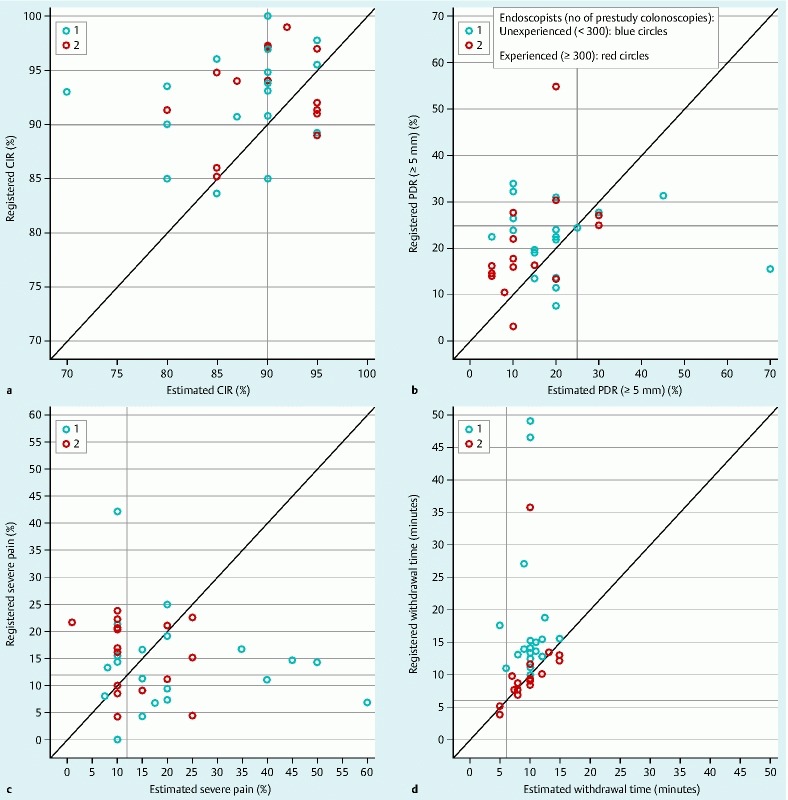
Fig. 1.

Scatterplots illustrating the relation between self-estimated quality and registered results for the various quality indicators for each individual endoscopist. Each circle represents one endoscopist. The x-axis displays that endoscopist’s guessed value, the y-axis shows the registered value. Circles on or very close to the 45°-line represent endoscopists who correctly guessed their quality. Blue circles represent endoscopists with less than 300 colonoscopies before registration in Gastronet and the red circles display more experienced endoscopists with 300 or more colonoscopies. a Cecum intubation rate. b Polyp detection rate for polyp ≥ 5 mm. c Rate of severely painful colonoscopies. d Withdrawal time
