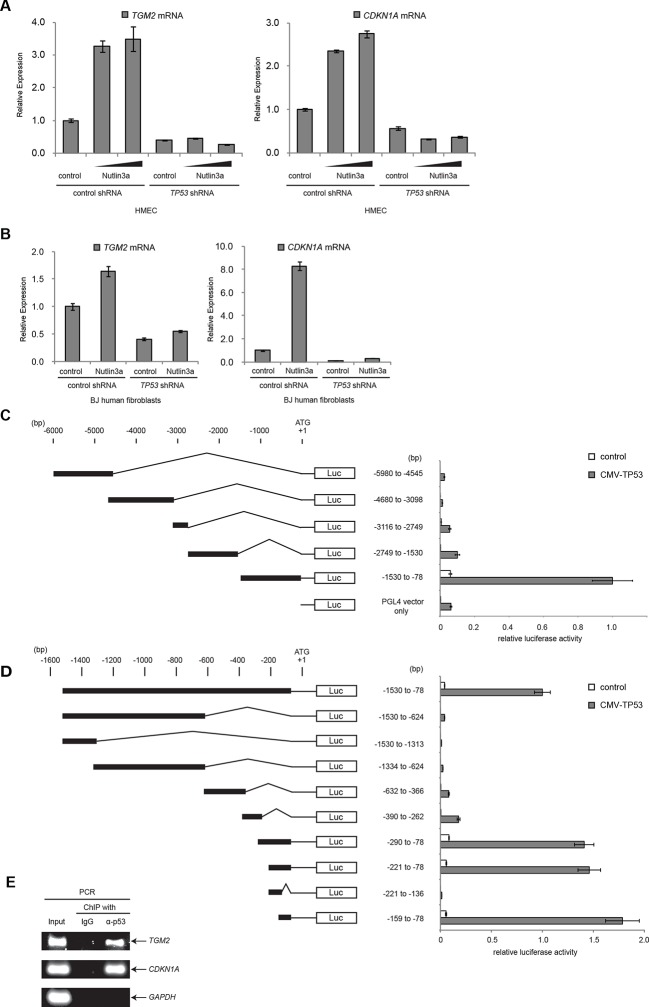
Figure 3. TGM2 is a potential target gene of TP53.
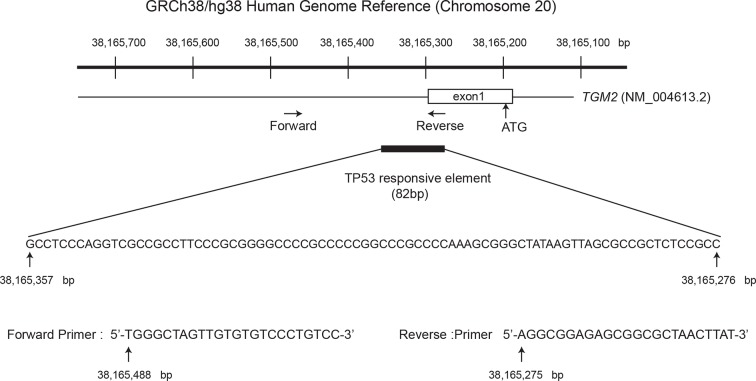
(A) qRT-PCR analysis of HMECTERT/ST/ER-RasV12 cells stably transduced with retroviruses expressing control or TP53 shRNAs. Cells were treated with Nutlin-3a (5 µM or 10 µM) for 2 days. The levels of mRNA were normalized to TBP expression and to control cells. CDKN1A is used as the positive control to see TP53 activation. The data indicate the average ± SD of biological triplicates. (B) qRT-PCR analysis of BJTERT/ST/ER-RasV12/shp16 cells stably transduced with retroviruses expressing control or TP53 shRNAs. Cells were treated with Nutlin-3a (10 µM) for 2 days. The levels of mRNA were normalized to TBP expression and to control cells. CDKN1A is used as the positive control to see TP53 activation. The data indicate the average ± SD of biological triplicates. (C and D) Luciferase reporter assays using a series of promoter deletion mutants of the TGM2 gene. The number (bp) indicates the position relative to the translational start site (ATG). Reporter plasmids containing the indicated deletion constructs were transfected into H1299 cells with control or TP53 plasmid, and luciferase activity was monitored. The average value of the luciferase activity from the cells transfected with CMV-TP53 and the reporter plasmid containing TGM2 (-1530 to -78) promoter fragment is set at 1, and the relative activity is shown. The data indicate the average ± SD of biological triplicates. (E) TP53 binds to the TGM2 promoter. ChIP assay was performed with an antibody detecting endogenous TP53, or IgG (negative control) using HMECTERT/ST/ER-RasV12 cells. The potential TP53 response element in the TGM2 promoter identified in (D) was analyzed by PCR. CDKN1A and GAPDH are served as the positive and negative control respectively.


