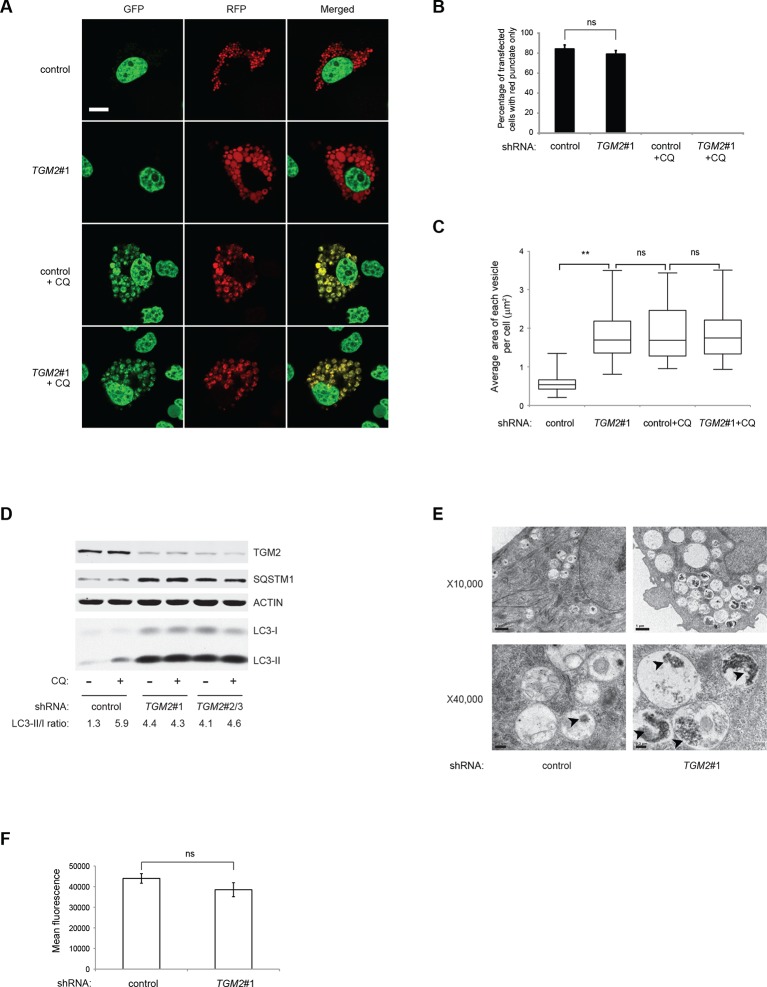
Figure 5. Loss of TGM2 expression inhibits autophagic protein degradation and autolysosome clearance.
(A) Formation of red punctae following autophagy induction in the absence of growth supplements. HMECTERT/ST/ER-RasV12 cells (control) and TGM2 shRNA cells (TGM2#1) were transfected with the plasmid RFP-GFP-LC3. Cells were incubated in medium without EGF, insulin, and hydrocortisone with or without chloroquine (20 µM) for 24 hr before visualization on confocal microscope. Scale bar: 5 μm (B) Quantification of fraction of cells showing only red punctate within the total population of transfected cells in (A). Cells were categorized and counted as in Figure 4B (>250 cells counted). (ns: not significant, student’s t-test) (C) Quantification of puntate size in control and TGM2 shRNA (TGM2#1) cells with and without chloroquine treatment. Average area of each vesicle per cell in (A) was analyzed by Image J software and represented as box plot. (**p<0.01, ns: not significant, student’s t-test) (D) Western blot analysis of HMECTERT/ST/ER-RasV12 cells expressing control and TGM2 shRNA using independent hairpins (TGM2#1 and double hairpins TGM2#2/3) treated with or without chloroquine (CQ, 50 μM, 2 hr) after incubation in medium without EGF, insulin, and hydrocortisone for 24 hr. Note that for TGM2#2/3, cells were generated by transducing with retrovirus carrying TGM2#2 and TGM2#3 shRNAs to achieve similar knock-down efficiency to TGM2 shRNA#1. β-ACTIN serves as the loading control. (E) Transmission electron microscopy images for control and TGM2 shRNA (TGM2#1) cells. Cells were incubated without EGF, Insulin, and hydrocortisone for 24 hr before fixing and imaging. The higher magnification micrograph (x40,000) shows presence of undigested protein aggregates (arrowheads) in autophagic vesicles. Lower magnification was set at x10,000. Scale bar: 1 μm at x10,000 and 0.2 μm at x40,000. (F) Flow cytometry analysis of cells stained with lysotracker after incubation in media without EGF, insulin, and hydrocortisone for 24 hr. The mean fluorescence intensity of control and TGM2 shRNA (TGM2#1) cells was quantified by Flowjo software. The data indicate the mean ± SD of biological triplicates. (ns: not significant, student’s t-test).

