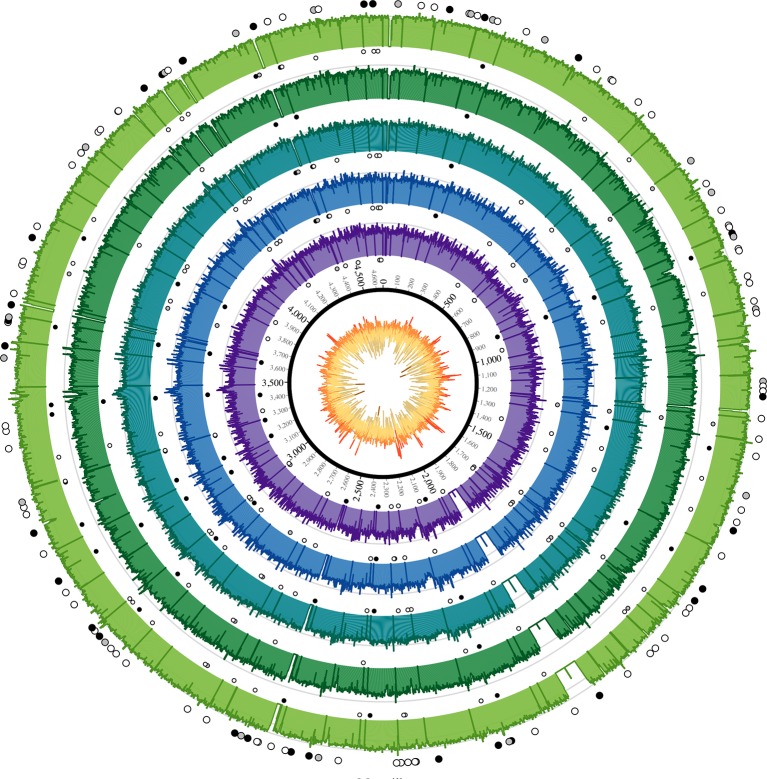
Figure 2. Coverage plots for all reconstructed Observance core genomes.
Inner ring: GC content from low (brown, <30%) to high (orange, >55%). Outer concentric rings: from inner to outer, coverage plots of OBS107, 110, 116, 124, and 137 on a logarithmic scale. Axes are at 30x and 100x. Dots: SNPs (black = non-synonymous, grey = synonymous, white = intergenic). Outer ring (larger dots) is SNPs shared by all five strains. Inner rings (smaller dots) are associated with the strain immediately outside and are SNPs that are not shared by all five strains (but may be shared by 2–4 strains). Krzywinski, M. et al. Circos: an Information Aesthetic for Comparative Genomics. Genome Res (2009) 19:1639–1645

