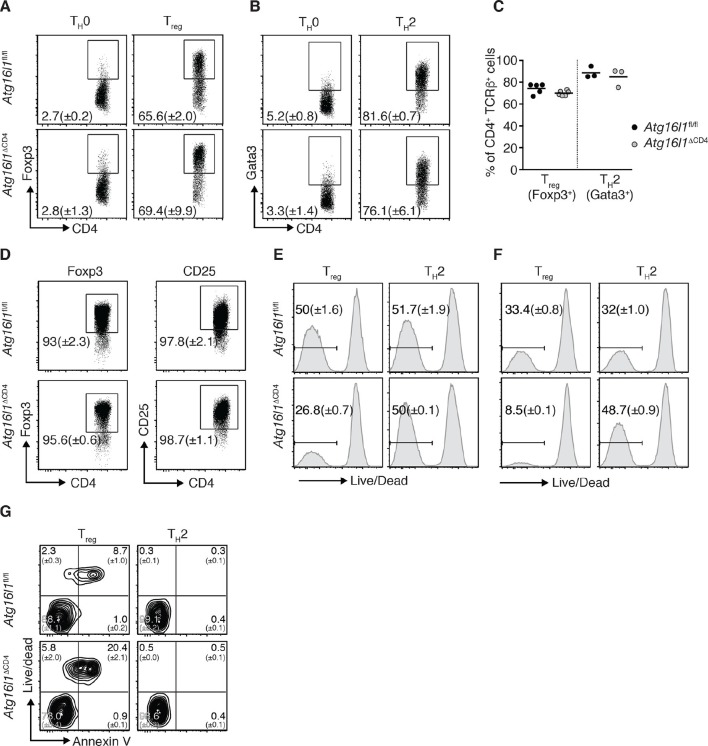
Figure 4. Atg16l1 promotes survival of Treg cells and limits TH2 cell survival.
(A,B) Atg16l1ΔCD4 or Atg16l1fl/fl naïve CD4+ T cells were cultured in TH0, Treg, or TH2 polarizing conditions for 48 hr and analyzed by FACS. Representative FACS plots show (A) Foxp3 and (B) Gata3 expression (gated on CD4+ TCRβ+ T cells). (C) Frequencies of Treg cells (Foxp3+) and TH2 cells (Gata3+) arising from Atg16l1ΔCD4 or Atg16l1fl/fl naïve CD4+ T cells cultured in Treg or TH2 polarizing conditions for 5 days. (D) Atg16l1ΔCD4 or Atg16l1fl/fl Treg cells were cultured with anti-CD3 (3 μg/ml) and anti-CD28 (1 μg/ml) for 48 hr, then maintained in the presence of IL-4 and IL-13 for a further 5 days before FACS analysis of Foxp3 and CD25 expression of live CD4+ T cells. (E,F) Naïve Atg16l1ΔCD4 or Atg16l1fl/fl CD4+ T cells were cultured with (E) 1 μg/ml or (F) 5 μg/ml anti-CD3 plus anti-CD28 (1 μg/ml) for 48 hr in Treg or TH2 polarizing conditions, then maintained in polarizing conditions for a further 5 days before FACS analysis of cell survival. Histograms show gates and frequencies of live CD4+ T cells. (G) Representative FACS plots of viability dye and Annexin V staining of Treg cells and TH2 cells from the cLP of young Atg16l1ΔCD4 and Atg16l1fl/fl littermates, gated on CD4+ TCRβ+ Foxp3+ (left panel), or CD4+ TCRβ+ Gata3+ (right panel). Data are representative from two (D,G) or three independent experiments (A,B,E,F), or are combined from three independent experiments (C). Each dot represents an individual cell culture (C) or data are shown as mean ± s.e.m (A,B,D-F). Numbers indicate percentage of cells in quadrants (G). cLP – colonic lamina propria. Young mice: 8–12 weeks old.

