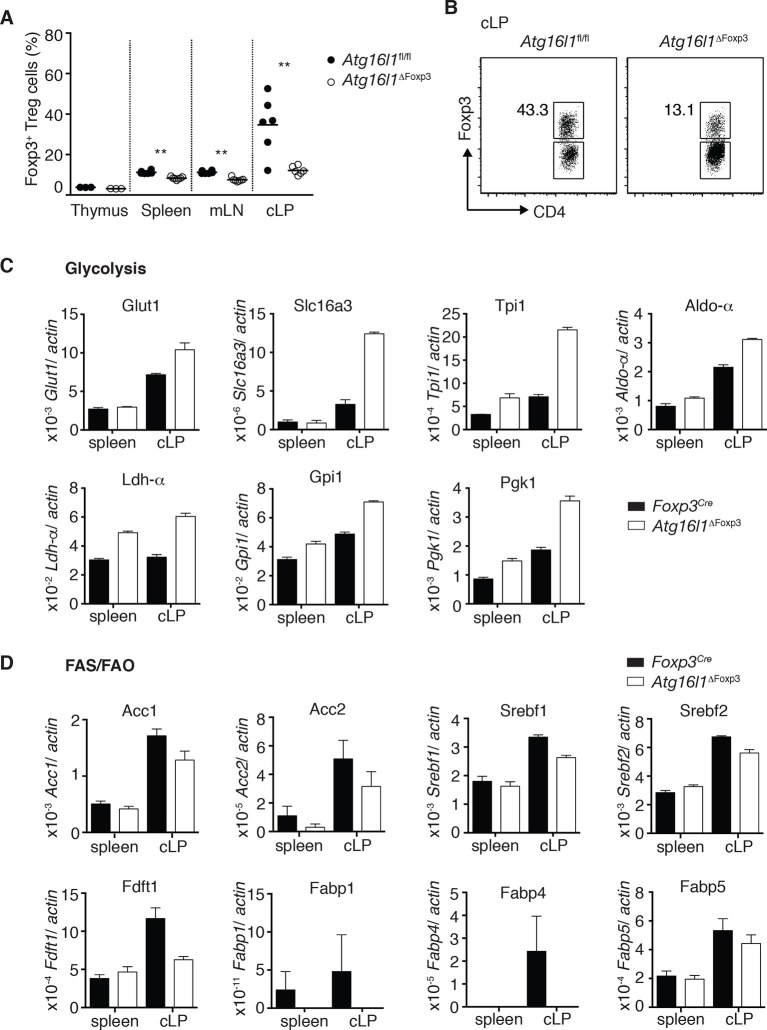
Figure 8. Cell-intrinsic autophagy is required for metabolic adaptation and survival of intestinal Foxp3+ Treg cells.
(A) Foxp3+ Treg cell frequencies among CD4+ TCRβ+ T cells in Atg16l1ΔFoxp3 and Atg16l1fl/fl littermates and (B) representative FACS plots of Foxp3 expression in cLP CD4+ T cells from young Atg16l1ΔFoxp3 and Atg16l1fl/fl littermates (gated on CD4+ TCRβ+ T cells). (C) qPCR analysis of glycolytic gene levels in sorted Foxp3+ Treg cells from spleen and cLP of young Atg16l1ΔFoxp3 and Foxp3Cre mice (sorted for CD4+ TCRβ+ YFP+). (D) qPCR analysis of FAS and FAO gene levels in Foxp3+ Treg cells from the spleen and cLP of young Atg16l1ΔFoxp3 and Foxp3Cre mice (sorted for CD4+ TCRβ+ YFP+). FAS: fatty acid synthesis, FAO: fatty acid oxidation, Glut1: glucose transporter 1, Slc16ac: solute carrier family 16 member 3 (lactic acid and pyruvate transporter), Tpi1: triosephosphate isomerase 1, Aldo–α: aldolase α, Ldh-α: lactate dehydrogenase α, Gpi1: Glucose phosphate isomerase 1, Pgk1: Phosphoglycerate kinase 1, Acc1: acetyl-CoA carboxylase 1, Acc2: acetyl-CoA carboxylase 2, Srebf1: sterol regulatory element binding transcription factor 1, Srebf2: sterol regulatory element binding transcription factor 2, Fdft1: farnesyl-diphosphate farnesyltransferase 1, Fabp: Fatty acid-binding protein. Data are representative from two (C,D) or three independent experiments (A,B). Each dot represents individual mouse (A) or data are shown as mean ± s.e.m (C,D). Gene expression levels are shown as mean ± s.e.m of three technical replicates (C,D). Numbers indicate percentage of cells in gates (B). cLP – colonic lamina propria. Young mice: 8–12 weeks old.


