. 2016 Mar 8;5:e13195. doi: 10.7554/eLife.13195

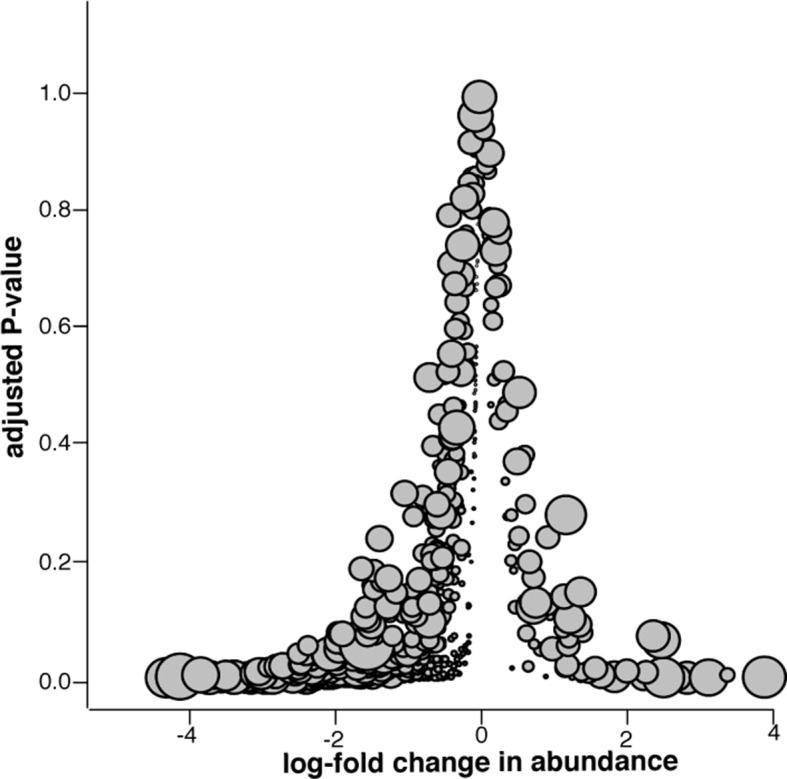
Figure 7. Microbiome changes from pre- to post-slaughter in all samples.

(A) Boxplot of Shannon’s diversity at the species level, pre- vs. post-slaughter across all sample matrices. Shannon’s diversity was significantly lower in post-slaughter samples when tested using Wilcoxon paired rank test (P<0.0001). See source data for Figure 7 (sheet 'Figure 7A') for Shannon’s Diversity Index by sample, which was used to produce boxplots. (B) Log2-fold change in abundance of genera from pre- to post-slaughter versus adjusted P–value, across all samples matrices. Dot size is proportional to the average abundance of the genus across all samples. For taxa table and counts used to produce model of log2-fold change in abundance, see Figure 7—source data 1 (sheet 'Figure 7B taxa table'); for model output, see Figure 7—source data 1 (sheet 'Figure 7B model output').

DOI: http://dx.doi.org/10.7554/eLife.13195.014

Figure 7—source data 1. Shannon’s diversity, taxa table and model output for Figure 7.
Sheet 1 ('Figure 7A') includes sample metadata and Shannon's Diversity Index calculated at the species level. Sheet 2 ('Figure 7B taxa table') includes the taxa count matrix, by sample, that was used to model log2-fold changes in abundance for Figure 7B and Figure 7—figure supplement 1. Sheet 3 ('Figure 7B model output') shows model output for log2-fold change in abundance at the genus level across all pre- and post-slaughter samples. Sheet 4 ('Figure 7 supp. Model output') shows model output for log2-fold change in abundance at the genus level between pre- and post-slaughter swab samples.
DOI: 10.7554/eLife.13195.015

Figure 7.

Figure 7—figure supplement 1. Microbiome changes from pre- to post-slaughter in swab samples only.

Figure 7—figure supplement 1.

Log2-fold change in abundance of genera from pre- to post-slaughter versus adjusted P–value, using only swab samples. Dot size is proportional to the average abundance of the genus across all samples. See Figure 7—source data 1 (sheet 'Figure 7 supp. model output') to view model output for the genus-level analysis of log2-fold change in abundance for swab samples only.