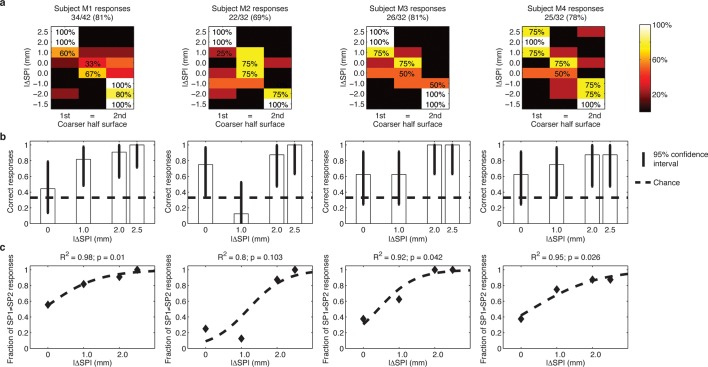
Figure 3. Responses of intact subjects during the 3AFC psychophysical protocol with percutaneous electrical microstimulation of the median nerve.
Each column reports results of the analyses on individual subject basis. (a) Each panel displays the confusion matrix of behavioral responses relative to the four intact subjects with microstimulation. The titles indicate correct/total responses (percentage). (b) Vertical bars display correct responses that are associated with each stimulus. The vertical solid lines over each bar indicate the 95% confidence intervals (Clopper Pearson exact interval) per stimulus. The dashed horizontal line indicates chance level (1/3). (c) The fraction of trials a pair of stimuli is perceived as different as a function of difference in spatial period (ΔSP) between the two stimulus halves, and logistic fit (dashed line). The title reports the R2 associated with the fit, i.e., the fraction of data variance explained by the logistic function, and the significance of the Pearson correlation between data points and the fit.

