. 2016 Mar 8;5:e09148. doi: 10.7554/eLife.09148

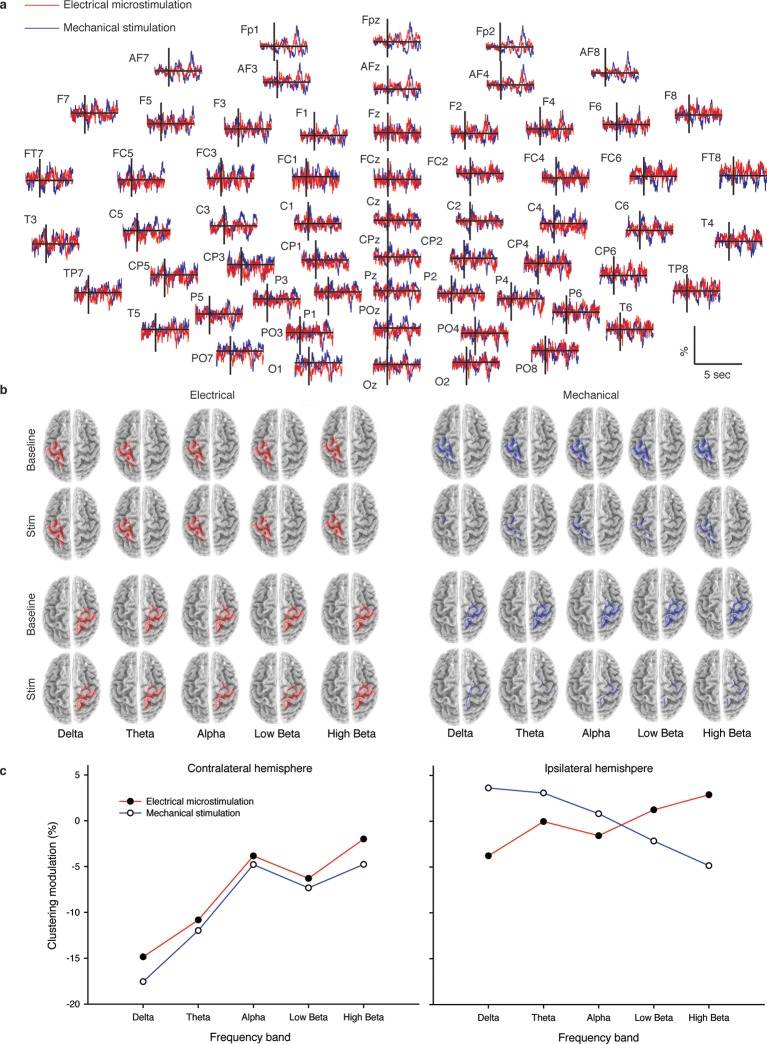
Figure 4. Cortical response to mechanical and electrical stimulation using a surface with 1.5 mm SP.

(a) Grand average event related potentials (ERPs) of all subjects (n = 4) for both substitutive neuromorphic electrical (red) and natural mechanical tactile (blue) stimulation, ranging from -1500 to 3000 ms with respect to the stimulus onset. Each channel was normalized for the standard deviation of the prestimulus. (b) eLORETA connectivity maps for delta, theta, alpha, low beta and high beta bands. Each tract (red for electrical and blue for mechanical stimulations) among the 7 sensorimotor regions of interest (Brodmann Areas BA 1–7) reports the connectivity value higher than the cut-off threshold (functional coupling >0.3). (c) Clustering modulation (percentage of variation during stimulation with respect to baseline) in the left and right hemispheres with electrical and mechanical stimulations. A significant reduction in clustering modulation across all frequencies occurred in the hemisphere contralateral to the stimulation (p<0.05, comparison to the right hemisphere, Duncan test after ANOVA).

DOI: http://dx.doi.org/10.7554/eLife.09148.007

Figure 4.

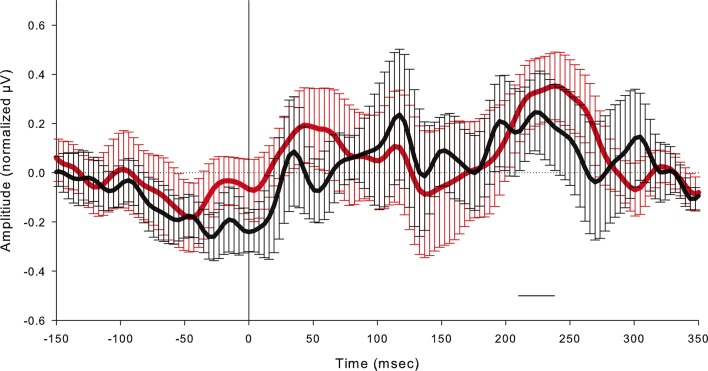
Figure 4—figure supplement 1. Grand average event related potentials (ERPs) of all subjects (n = 4) at the FC1 electrode for both the substitutive neuromorphic electrical (red) and natural mechanical tactile (black) stimulation, in the -150 to 350 ms window with respect to stimulus onset, with confidence interval bars.

Figure 4—figure supplement 1.

The horizontal black bar indicates the time window (210–240 ms) when the evoked potential reached significance compared with the prestimulus voltage (2 Standard Deviations from the mean prestimulus voltage), both after the electrical microstimulation and after the mechanical stimulation.
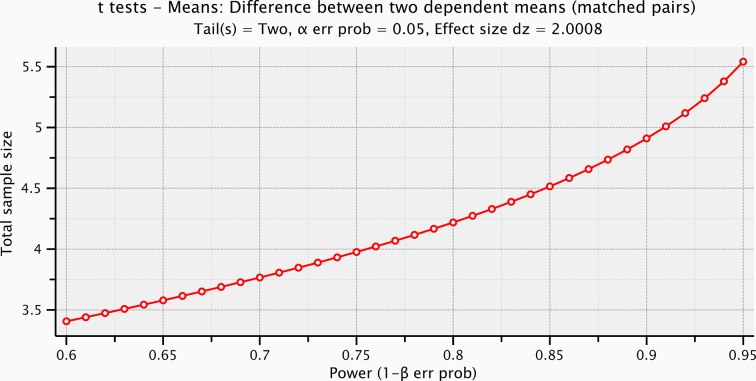
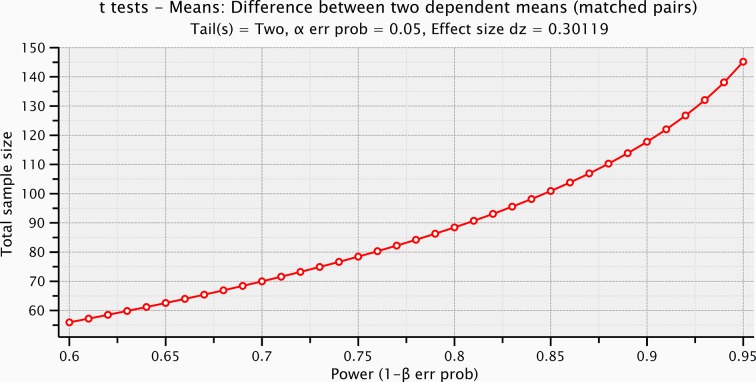
Figure 4—figure supplement 2. Sample size computation based on the effect size of the prestimulus and the evoked activity within the significant time-window for the electrical microstimulation.

Figure 4—figure supplement 2.

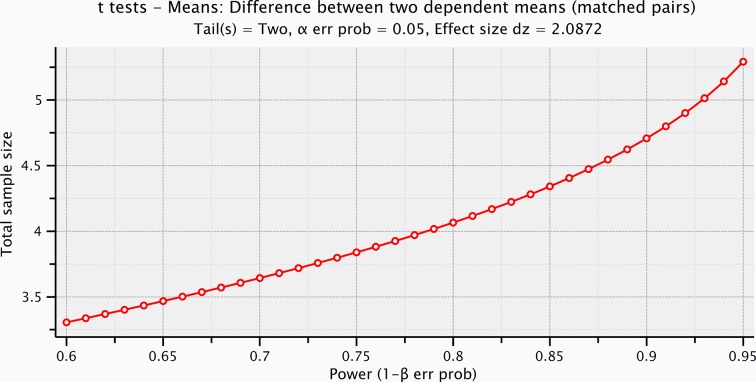
Figure 4—figure supplement 3. Sample size computation based on the effect size of the prestimulus and the evoked activity within the significant time-window for the mechanical stimulation.

Figure 4—figure supplement 3.

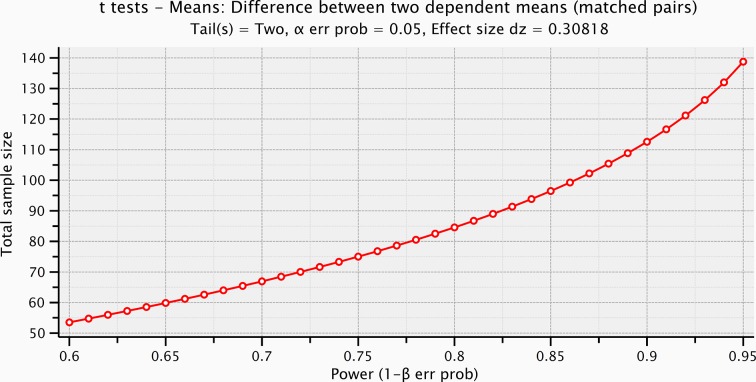
Figure 4—figure supplement 4. Sample size computation based on the prestimulus effect sizes preceding the electrical microstimulation and the mechanical stimulation.

Figure 4—figure supplement 4.

Figure 4—figure supplement 5. Sample size computation based on the effect size of the stimulus voltages (ERPs within the significant time-window after the electrical microstimulation, and after the mechanical stimulation).

Figure 4—figure supplement 5.