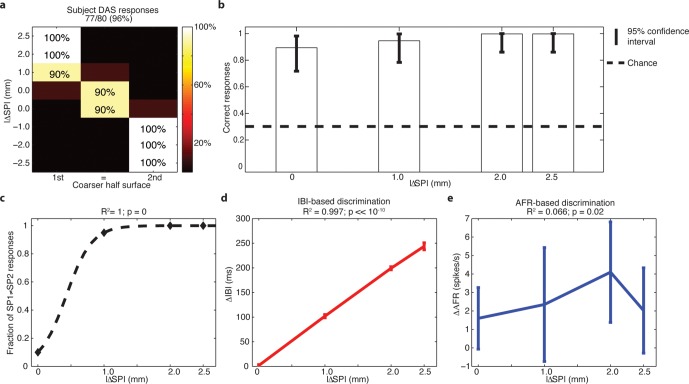
Figure 9. Subject behavior and analysis based on the stimulus spatial period (SP), inter-burst interval (IBI) and average firing rate (AFR) in the session with DAS amputee.
(a) Confusion matrix of the responses given by DAS subject. (b) Vertical bars display the correct responses, which are associated with each stimulus. The vertical solid lines over each bar indicate the 95% confidence intervals (Clopper Pearson exact interval) per stimulus. The dashed horizontal line indicates chance level (1/3). (c) Fraction of trials for which a pair of stimuli is perceived as different as a function of the difference in spatial period (ΔSP) between the two stimulus halves, and logistic fit (dashed line). The title reports the R2 associated with the fit, i.e., the fraction of data variance explained by the logistic function, and the significance of the Pearson correlation between data points and the fit. (d,e) Comparison between IBI-based and AFR-based discrimination. Difference between IBIs (ΔIBI, panel d) and difference between AFRs (ΔAFR, panel e) measured in the spike patterns elicited by the two sides of each stimulus and plotted as a function of the difference between grating SPs (ΔSP). Error bars indicate the interquartile range. The title reports the fraction of explained variance.

