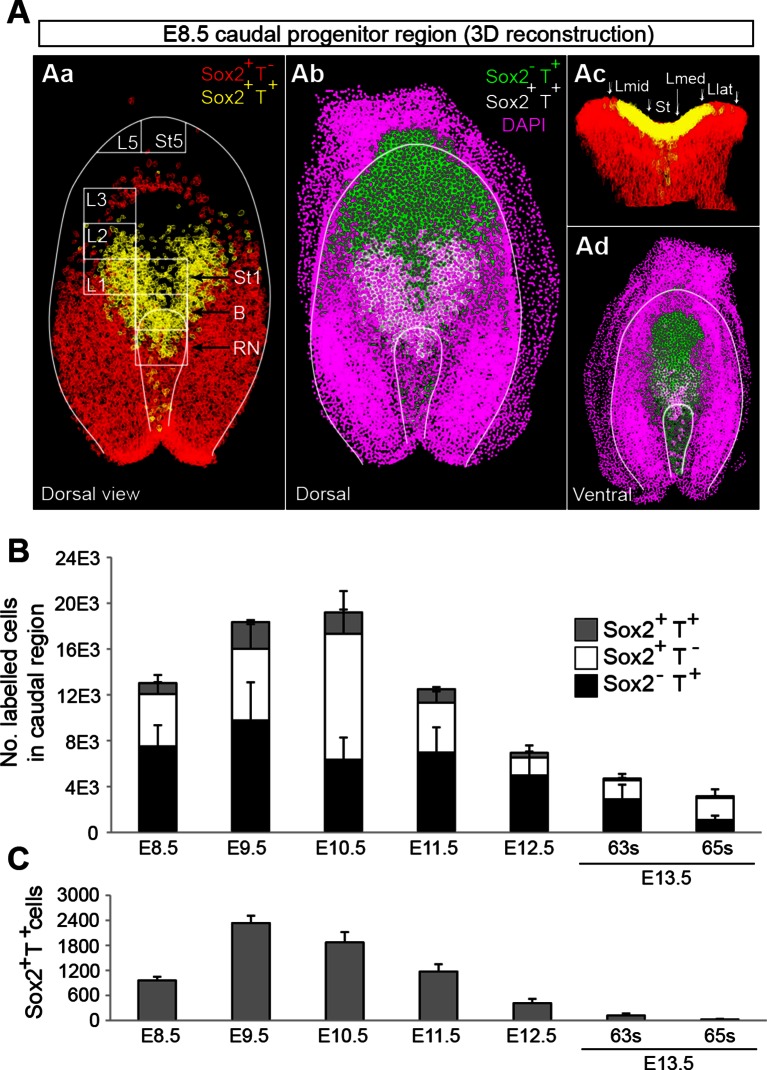
Figure 4. Sox2+T+ NMPs peak at mid trunk formation.
(A) 3D reconstruction of the E8.5 caudal region. (Aa–b) Dorsal view. (Ac) Frontal view along the PS and CLE. Colours show different thresholded Sox2/T populations. (B–C) Quantification of different Sox2/T populations in the caudal embryo shows a peak in overall cell labelling at E10.5 (B). Sox2+T+ cell numbers are highest at E9.5 (C). Data in graphs is shown as the mean ± s.d. See also Figure 3—figure supplement 1B–E and Video 1.

