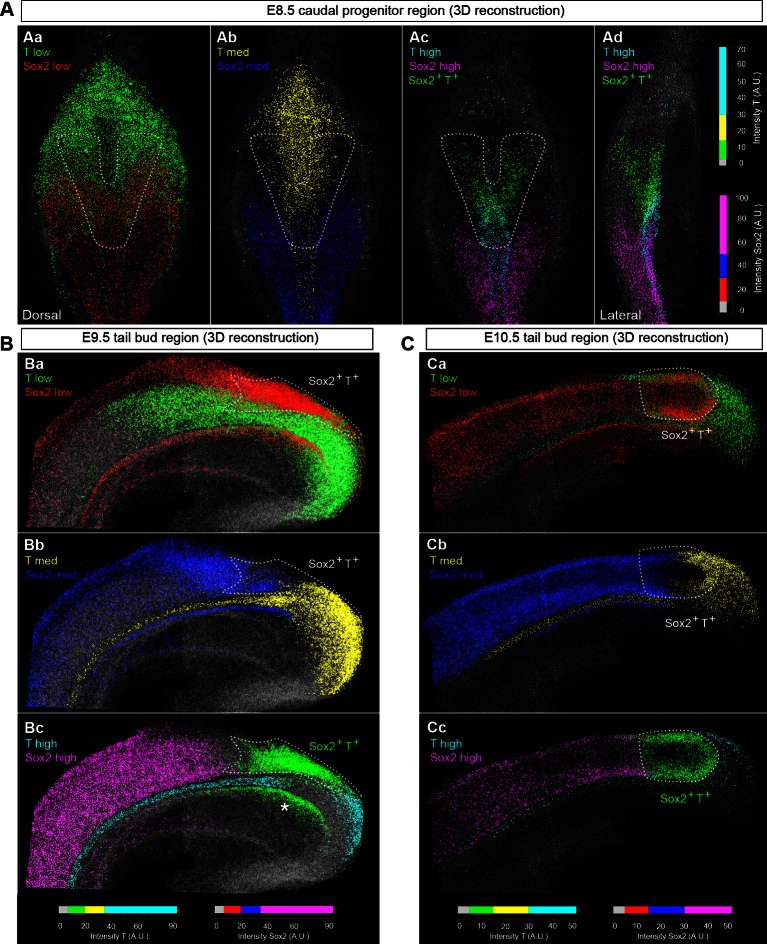
Figure 5. NMPs express low levels of T and Sox2.
(A–C) 3D analysis showing the relative levels of Sox2 and T protein in the E8.5–10.5 caudal region. Sox2+T+ cells express low-to-medium levels of both transcription factors (green cells in Ac, Ad, Bc and Cc represent Sox2+T+ cells, indicated by the area within the white dotted line). Colours represent the intensity range shown as arbitrary units (AU). The lower threshold for positivity was calculated as before (see Figure 3—figure supplement 1B), with the maximum corresponding to the highest intensity recorded in the z-stack. Asterisk, Sox2+T+ cells found in the dorsocaudal part of the gut; grey, segmented nuclear volumes negative for either transcription factor.

