. 2016 Jan 18;5:e10042. doi: 10.7554/eLife.10042

Figure 6. Fate in the caudal lateral epiblast.

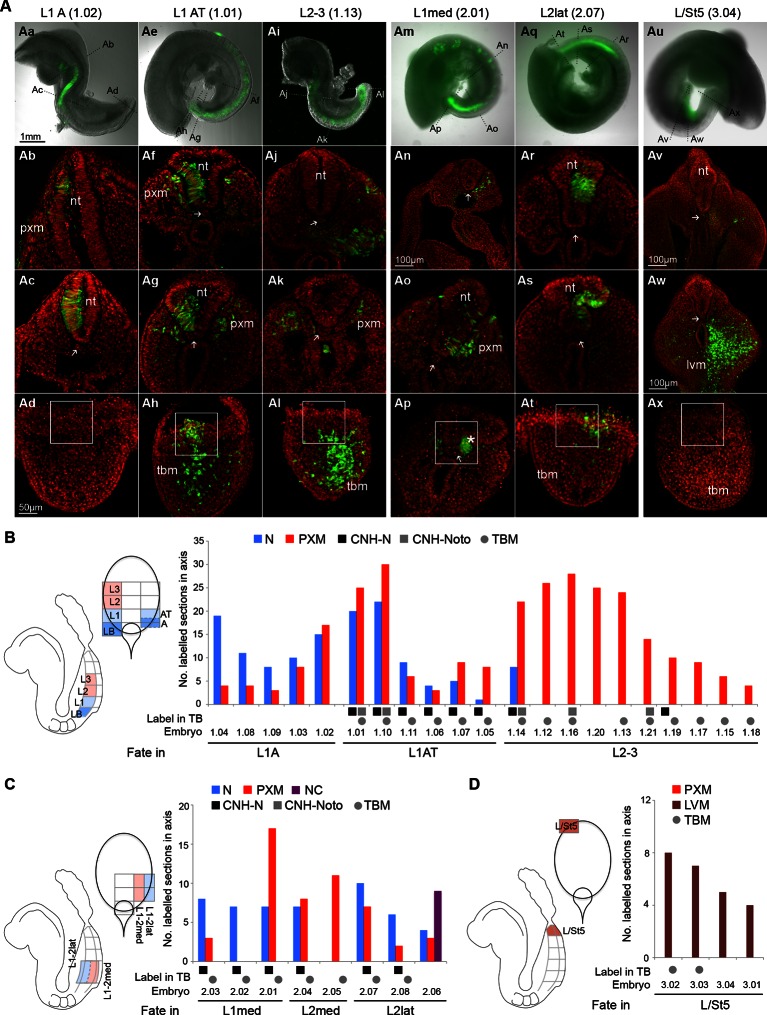
(A) Representative examples of homotopic CLE grafts (numbers identify individual embryos in BD). Cell fate in the rostral CLE in rostral-to-caudal (Aal) and medial-to-lateral direction (Am–t). Cell fate in the caudal-most lateral epiblast (Aux). Arrows show the notochord; white boxes the CNH. lvm, lateral and ventral mesoderm; nt, neural tube; pxm, paraxial mesoderm; tbm, tail bud mesoderm. (BD) Diagrams indicate the graft type performed, the shading within them, the predominant prospective fate of each region (pink, mesoderm; light blue, neuromesodermal; dark blue, neural; light brown, lateral/ventral mesoderm). Graphs display single grafted embryos and their contribution in the differentiated axis to the neurectoderm (N) and mesoderm (PXM) or both. Numbers below the bars indicate the graft series followed by an individual embryo identifier (e.g. embryo 1.01). Below the x-axis, graft cell contribution in the TB (dorsal part of the CNH, ventral (notochordal) part of CNH and TBM), is represented by a black square, grey square or grey circle, respectively. (B) Fate in L1, L2 and L3. L1 grafts gave rise to two distinct contribution patterns, L1A (axis only) and L1AT (axis and tail bud). (C) Fate in either the medial or lateral half of L1 or L2. One graft (embryo 2.06) contributed to the neural crest (NC). (D) Grafts of L/St5 contributed entirely to the lateral/ventral mesoderm (LVM). Unilateral versus bilateral PXM contribution is shown in Figure 6—figure supplement 4.

DOI: http://dx.doi.org/10.7554/eLife.10042.010

Figure 6—source data 1. Presomitic mesoderm contamination in CLE grafts.
Additional information and analysis to show the majority of paraxial mesoderm in CLE grafts is derived from NMPs rather than contaminating PSM progenitors that were co-grafted.
DOI: 10.7554/eLife.10042.011

Figure 6.

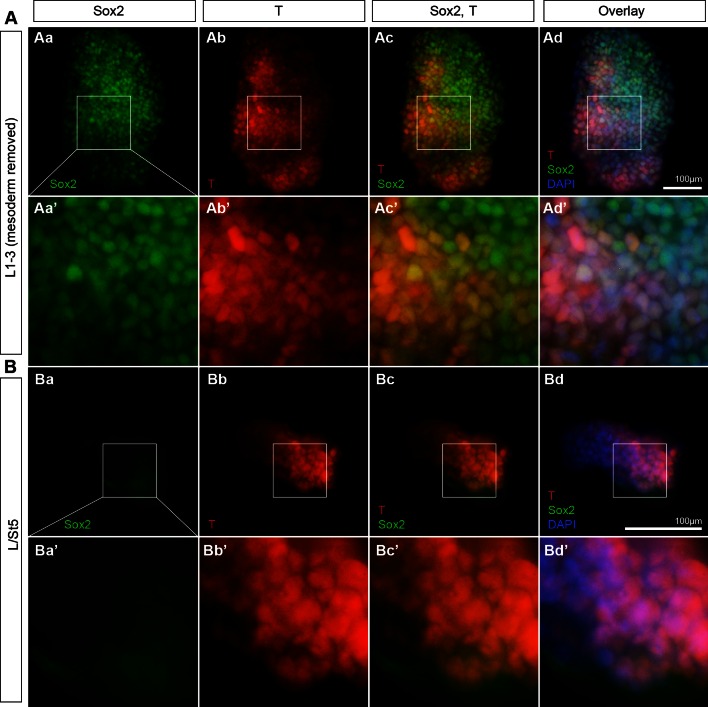
Figure 6—figure supplement 1. Rostral CLE tissue contains Sox2+Tcells.

Figure 6—figure supplement 1.

Graft donor tissue was examined for the presence of Sox2/T coexpressing cells. L1-3 and L/St5 pieces were dissected as described above. The underlying presomitic mesoderm was manually removed in the L1-3 grafts. (A) L1-3 donor tissue contains Sox2+T+ cells (n = 7/7). (B) L/St5 were devoid of coexpressing cells (n = 5/5). Blue, DAPI nuclear stain; green, Sox2; red, T.
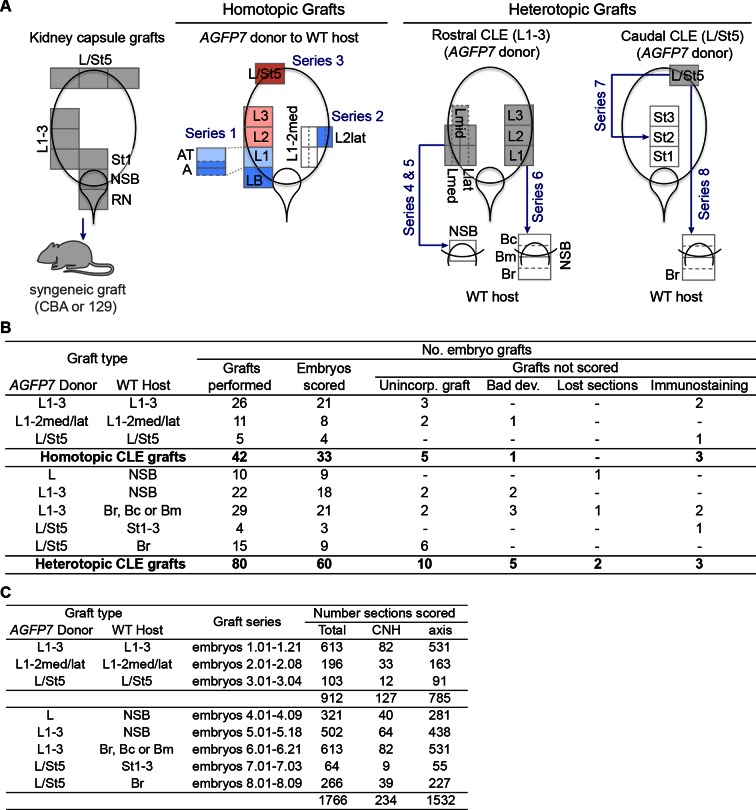
Figure 6—figure supplement 2. Embryo numbers and section count in different grafting experiments.

Figure 6—figure supplement 2.

(A) Schematic diagram summarising the different grafting experiments conducted in this work and the embryos series they correspond to. Diagrams represent the primitive streak region at E8.5, with coloured regions the donor tissue. In homotopic grafts, the colour indicates the predominant fate in that region (pink, mesoderm; light blue, neuromesodermal; dark blue, neural; dark pink, lateral/ventral mesoderm). (B) Number of embryo grafts performed in this study, using AGFP7 donor cells. The number of embryos that was not scored (and reasons thereof) is also shown. (C) Number of sections scored for each graft series performed.
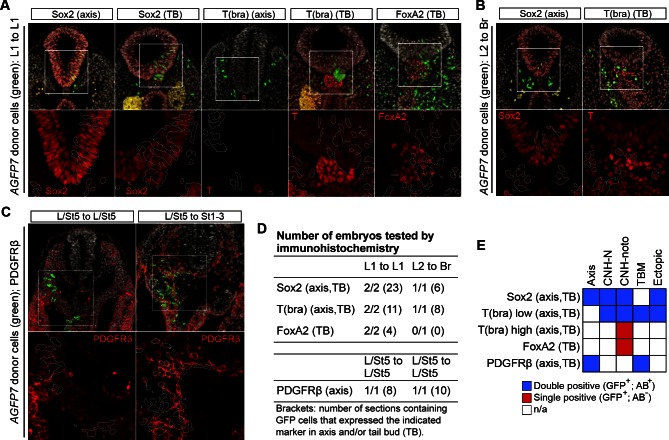
Figure 6—figure supplement 3. Homotopic and heterotopic grafts incorporate well into host embryos.

Figure 6—figure supplement 3.

(AC) Immunohistochemical confirmation of differentiation markers in different graft series. Upper row, DAPI-counterstained images (grey). Boxes, region magnified in lower row. Lower row, immunofluorescence channel. Position of grafted donor cells is outlined in white. (A) Sox2, T, and Foxa2 expression in axis and TB sections of L1 homotopic grafts. Note lack of notochord-specific Foxa2 expression in graft-derived cells. (B) Sox2 and T expression in axis and TB sections of L2-3 heterotopic grafts (to Br). (C) PDGFRβ expression in L/St5-derived cells, grafted either homo- or heterotopically to a wildtype host. (D) Table showing the number of embryos and sections stained for each marker. (E) Overview of marker expression in different regions of the axis. Note that none of the CLE-derived grafted cells expressed FoxA2 or high levels of T protein in the caudal notochord domain.
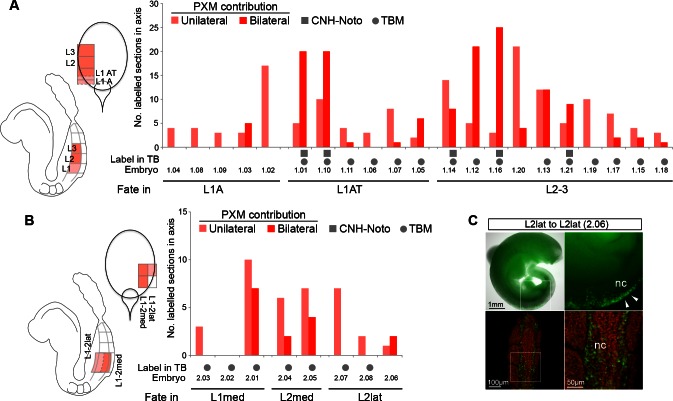
Figure 6—figure supplement 4. Fate of the CLE progenitors in the paraxial mesoderm.

Figure 6—figure supplement 4.

(A-B) Scoring of GFP+ cell contribution to the paraxial mesoderm in CLE homotopic grafts (embryo series 1 and 2). No PXM contribution was observed in L/St5 homotopic grafts. Graph format is the same as in Figure 6. Pink bars show unilateral contribution; red bars bilateral contribution. (C) One grafted embryo (embryo 2.06) showed contribution to the neural crest (nc, white arrows).