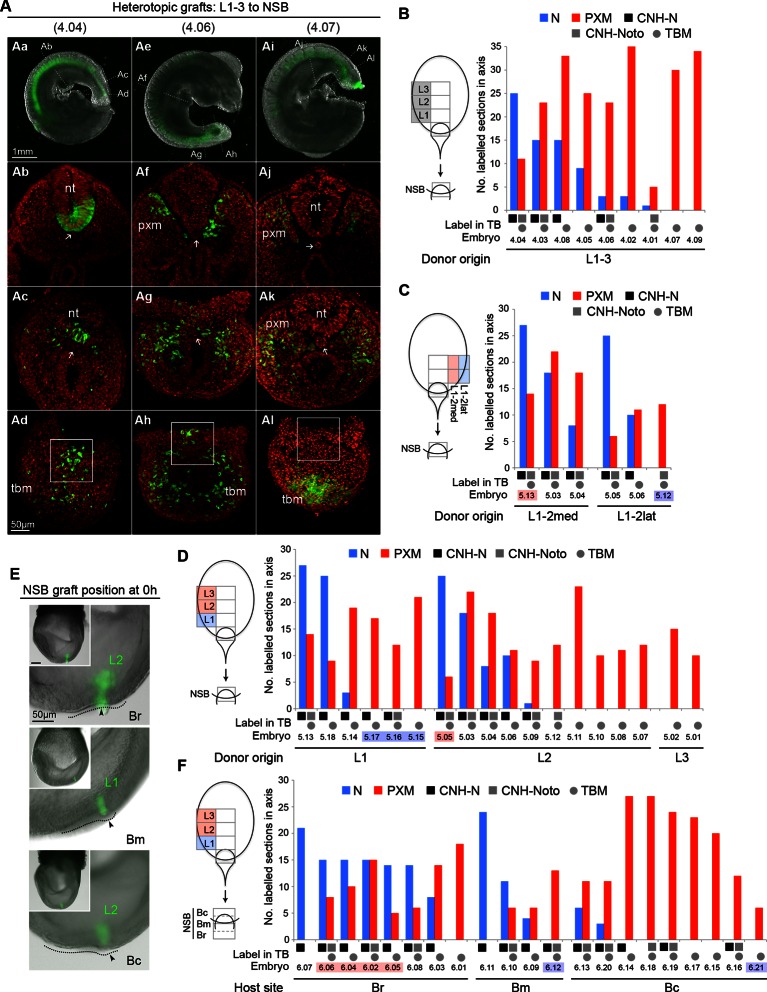
Figure 7. Plasticity of L1-3 cells on heterotopic grafting to the NSB.
(A) Representative examples of heterotopic CLE grafts (numbers identify individual embryos in B). Three different contribution patterns were observed: mainly neural (Aa-d), neuromesodermal (Ae–h) and mainly mesodermal (Ai–l). (B–D and F) Scoring of GFP+ cell contribution in CLE-to-NSB heterotopic grafts. Graph format is the same as in Figure 6. Highlighted numbers indicate embryos in which the graft fate has changed from that predicted by the fate map upon heterotopic grafting. (B) Grafts of L1, 2 or 3 to the NSB. (C) Grafts of medial or lateral halves of L1 or L2 to the NSB. Note that these embryos are also scored with respect to their rostrocaudal origin in D. (D) Grafts of L1, 2 or 3 to the NSB. Note that some of these embryos are also scored according to their mediolateral origin. For example embryo 5.13 received a graft of cells from medial L1, and showed high neural contribution and is therefore highlighted as ‘changed fate’ in C but not in D. (E) Graft position at the start of culture (to Br, Bm or Bc). Donor origin is shown in green. The crown (arrowhead) of the node (dotted line) was used as a landmark for placing GFP+ donor cells (green). (F) Grafts of L1, 2 or 3 to different aspects of the NSB shows the fate of rostral CLE cells is dependent on the environmental cues of the host.

