
Figure 8. Dorsolateral bias of L1-3 cells is reset upon grafting to the midline.
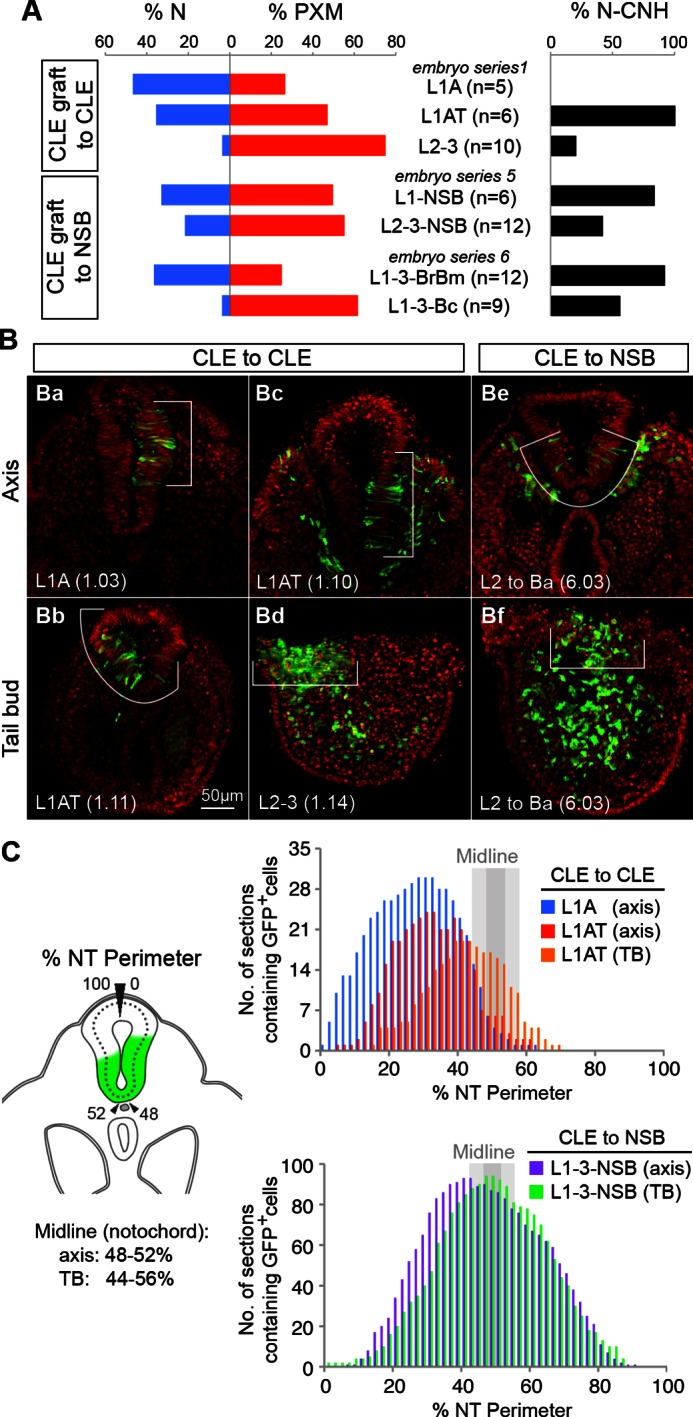
(A) Quantitative analysis of L1-3 graft contribution. Left, the percentage of neural (N) vs paraxial mesoderm (PXM) contribution in all scorable sections. Right, the percentage of embryos with dorsal (neural) CNH contribution. Labels show the embryo series and the graft performed (with n, the number of embryos). (B) Representative examples of dorsolateral NT distribution of grafted cells to either one lateral side (CLE to CLE) or to the midline (CLE to NSB). White lines show the extent of NT contribution. (C) Left, diagram shows the method used to score mediolateral NT contribution of donor cells (green), expressed as a percentage of the NT perimeter. Right, graphs display the number of sections containing GFP+ cells at defined positions along the NT. Colours represent graft type (blue, L1A homotopic grafts; red and orange, L1AT homotopic grafts; purple and green, L1-3 to NSB heterotopic grafts). Sections in the TB are represented separately from those anterior to the TB (termed ‘axis’). The average notochord position at the ventral midline is shown by dark grey (axis) and light grey (TB) shading.